IBM 2015 Annual Report Download - page 46
Download and view the complete annual report
Please find page 46 of the 2015 IBM annual report below. You can navigate through the pages in the report by either clicking on the pages listed below, or by using the keyword search tool below to find specific information within the annual report.-
 1
1 -
2
-
3
-
4
-
5
-
6
-
7
-
8
-
9
-
10
-
11
-
12
-
13
-
14
-
15
-
16
-
17
-
18
-
19
-
20
-
21
-
22
-
23
-
24
-
25
-
26
-
27
-
28
-
29
-
30
-
31
-
32
-
33
-
34
-
35
-
 36
36 -
 37
37 -
 38
38 -
 39
39 -
 40
40 -
 41
41 -
 42
42 -
 43
43 -
 44
44 -
 45
45 -
 46
46 -
 47
47 -
 48
48 -
 49
49 -
 50
50 -
 51
51 -
 52
52 -
 53
53 -
 54
54 -
 55
55 -
 56
56 -
57
-
58
-
59
-
60
-
61
-
62
-
63
-
64
-
65
-
66
-
67
-
68
-
69
-
70
-
71
-
72
-
73
-
74
-
75
-
76
-
77
-
78
-
79
-
80
-
81
-
82
-
83
-
84
-
85
-
86
-
87
-
88
-
89
-
90
-
91
-
92
-
93
-
94
-
95
-
96
-
97
-
98
-
99
-
100
-
101
-
102
-
103
-
104
-
105
-
106
-
107
-
108
-
109
-
110
-
111
-
112
-
113
-
114
-
115
-
116
-
117
-
118
-
119
-
120
-
121
-
122
-
123
-
124
-
125
-
126
-
127
-
128
-
129
-
130
-
131
-
132
-
133
-
134
-
135
-
136
-
137
-
138
-
139
-
140
-
141
-
142
-
143
-
144
-
145
-
146
-
147
-
148
-
149
-
150
-
151
-
152
-
153
-
154
-
155
-
156
 |
 |

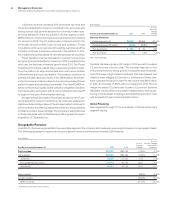
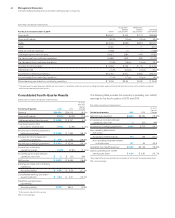
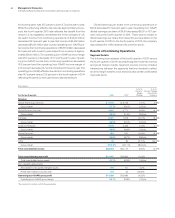
44 Management Discussion
International Business Machines Corporation and Subsidiary Companies
($ inmillions)
For the fourth quarter: 2015 2014*
Yr.-to-Yr.
Percent/
Margin
Change
Yr.-to-Yr.
Percent Change
Adjusted for
Currency
Revenue
Global Technology Services $ 8,126 $ 8,746 (7.1)% 0.9%
Gross margin 37.7% 39.1% (1.5) pts.
Global Business Services 4,297 4,771 (9.9)% (4.2)%
Gross margin 28.2% 31.5% (3.3) pts.
Software 6,767 7,578 (10.7)% (5.8)%
Gross margin 88.0% 90.0% (2.0) pts.
Systems Hardware 2,372 2,406 (1.4)% 2.7%
Gross margin 48.0% 49.6% (1.6) pts.
Global Financing 454 532 (14.6)% (5.8)%
Gross margin 39.9% 48.7% (8.8) pts.
Other 43 82 (47.1)% (42.2)%
Gross margin (312.7)% (401.7)% (89.0) pts.
Total consolidated revenue $22,059 $24,113 (8.5)% (2.3)%
Total consolidated gross profi t $11,407 $12,862 (11.3)%
Total consolidated gross margin 51.7% 53.3% (1.6) pts.
Non-operating adjustments
Amortization of acquired intangible assets 105 101 3.2%
Retirement-related costs/(income) 119 33 262.8%
Operating (non-GAAP) gross profi t $11,630 $12,996 (10.5)%
Operating (non-GAAP) gross margin 52.7% 53.9% (1.2 ) pts.
* Reclassified to conform with 2015 presentation.
the fourth quarter was 12.5percent, down 9.7points year to year.
While the underlying effective tax rate was approximately 20per-
cent, the fourth quarter 2015 rate reflected the benefit from the
recent U.S. tax legislation and settlement of the company’s U.S.
tax audit. Income from continuing operations of $4,460 million
decreased 19.1percent year to year. Net income of $4,463 million
decreased $1,021 million year to year. Operating (non-GAAP) pre-
tax income from continuing operations of $5,516 million decreased
25.4percent with a year-to-year impact from currency of approx-
imately $300 million. The operating (non-GAAP) pre-tax margin
was 25.0percent, a decrease of 5.7points year to year. Operat-
ing (non-GAAP) income from continuing operations decreased
18.6percent and the operating (non-GAAP) income margin of
21.3percent decreased 2.7points compared to the prior year. The
operating (non-GAAP) effective tax rate from continuing operations
was 14.7percent versus 21.8percent in the fourth quarter of 2014
reflecting the same current year factors described above.
Diluted earnings per share from continuing operations of
$4.59 decreased 17.1percent year to year. Operating (non-GAAP)
diluted earnings per share of $4.84 decreased $0.97 or 16.7per-
cent versus the fourth quarter of 2014. There was no impact to
diluted earnings per share from discontinued operations in the
fourth quarter of 2015. In the fourth quarter of 2015, the company
repurchased 6.0million shares of its common stock.
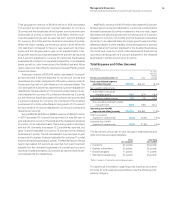
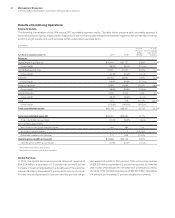
Results of Continuing Operations
Segment Details
The following is an analysis of the fourth quarter of 2015 versus
the fourth quarter of 2014 reportable segment external revenue
and gross margin results. Segment pre-tax income includes
transactions between the segments that are intended to reflect
an arms-length transfer price and excludes certain unallocated
corporate items.