IBM 2015 Annual Report Download - page 131
Download and view the complete annual report
Please find page 131 of the 2015 IBM annual report below. You can navigate through the pages in the report by either clicking on the pages listed below, or by using the keyword search tool below to find specific information within the annual report.-
 1
1 -
2
-
3
-
4
-
5
-
6
-
7
-
8
-
9
-
10
-
11
-
12
-
13
-
14
-
15
-
16
-
17
-
18
-
19
-
20
-
21
-
22
-
23
-
24
-
25
-
26
-
27
-
28
-
29
-
30
-
31
-
32
-
33
-
34
-
35
-
36
-
37
-
38
-
39
-
40
-
41
-
42
-
43
-
44
-
45
-
46
-
47
-
48
-
49
-
50
-
51
-
52
-
53
-
54
-
55
-
56
-
57
-
58
-
59
-
60
-
61
-
62
-
63
-
64
-
65
-
66
-
67
-
68
-
69
-
70
-
71
-
72
-
73
-
74
-
75
-
76
-
77
-
78
-
79
-
80
-
81
-
82
-
83
-
84
-
85
-
86
-
87
-
88
-
89
-
90
-
91
-
92
-
93
-
94
-
95
-
96
-
97
-
98
-
99
-
100
-
101
-
102
-
103
-
104
-
105
-
106
-
107
-
108
-
109
-
110
-
111
-
112
-
113
-
114
-
115
-
116
-
117
-
118
-
119
-
120
-
 121
121 -
 122
122 -
 123
123 -
 124
124 -
 125
125 -
 126
126 -
 127
127 -
 128
128 -
 129
129 -
 130
130 -
 131
131 -
 132
132 -
 133
133 -
 134
134 -
 135
135 -
 136
136 -
 137
137 -
 138
138 -
 139
139 -
 140
140 -
 141
141 -
142
-
143
-
144
-
145
-
146
-
147
-
148
-
149
-
150
-
151
-
152
-
153
-
154
-
155
-
156
 |
 |

Notes to Consolidated Financial Statements
International Business Machines Corporation and Subsidiary Companies
129
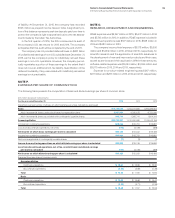
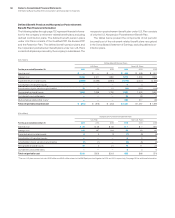
Plan Financial Information
Summary of Financial Information
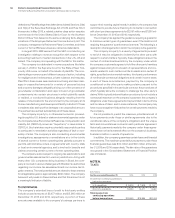
The following table presents a summary of the total retirement-related benefits net periodic (income)/cost recorded in the Consolidated
Statement of Earnings.
($ inmillions)
U.S. Plans Non-U.S. Plans Total
For the year ended December 31: 2015 2014 2013 2015 2014 2013 2015 2014 2013
Defi ned benefi t pension plans $(284) $(833) $(223) $1,421 $1,267 $1,396 $1,137 $ 434 $1,173
Retention Plan 23 15 21 ——— 23 15 21
Total defi ned benefi t pension plans (income)/cost $(261) $(818) $(202) $1,421 $1,267 $1,396 $1,160 $ 449 $1,195
IBM 401(k) Plus Plan and non-U.S. plans $ 676 $ 713 $ 785 $ 442 $ 526 $ 575 $1,117 $1,239 $1,361
Excess 401(k) 21 14 24 ——— 21 14 24
Total defi ned contribution plans cost $ 697 $ 727 $ 809 $ 442 $ 526 $ 575 $1,138 $1,253 $1,384
Nonpension postretirement benefi t plans cost $ 218 $ 206 $ 218 $ 55 $ 66 $ 79 $ 273 $ 272 $ 298
Total retirement-related benefi ts
net periodic cost $ 654 $ 115 $ 826 $1,918 $1,859 $2,051 $2,572 $1,974 $2,876
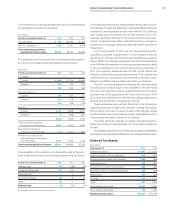
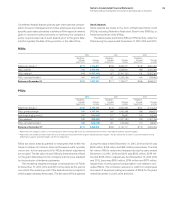
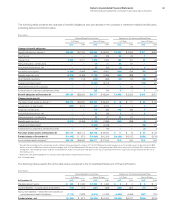
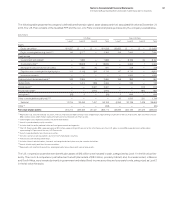
The following table presents a summary of the total PBO for defined benefit pension plans, APBO for nonpension postretirement benefit
plans, fair value of plan assets and the associated funded status recorded in the Consolidated Statement of Financial Position.
($ inmillions)
Benefi t Obligations Fair Value of Plan Assets Funded Status*
At December 31: 2015 2014 2015 2014 2015 2014
U.S. Plans
Overfunded plans
Qualifi ed PPP $51,287 $54,708 $51,716 $55,772 $ 429 $ 1,065
Underfunded plans
Excess PPP $ 1,522 $ 1,602 $ — $ — $ (1,522) $ (1,602)
Retention Plan 312 334 ——(312) (334)
Nonpension postretirement benefi t plan 4,652 5,053 71 16 (4,582) (5,037)
Total underfunded U.S. plans $ 6,486 $ 6,989 $ 71 $ 16 $ (6,415) $ (6,973)
Non-U.S. Plans
Overfunded plans
Qualifi ed defi ned benefi t pension plans $16,766 $16,794 $18,070 $17,888 $ 1,304 $ 1,094
Nonpension postretirement benefi t plans 011 011 00
Total overfunded non-U.S. plans $16,766 $16,804 $18,070 $17,898 $ 1,304 $ 1,094
Underfunded plans
Qualifi ed defi ned benefi t pension plans $22,039 $26,278 $17,677 $21,655 $ (4,362) $ (4,623)
Nonqualifi ed defi ned benefi t pension plans 5,911 6,762 ——(5,911) (6,762)
Nonpension postretirement benefi t plans 618 806 59 73 (558) (733)
Total underfunded non-U.S. plans $28,568 $33,846 $17,737 $21,729 $(10,832) $(12,118)
Total overfunded plans $68,053 $71,512 $69,786 $73,671 $ 1,734 $ 2,159
Total underfunded plans $35,054 $40,836 $17,807 $21,745 $(17,247) $(19,091)
* Funded status is recognized in the Consolidated Statement of Financial Position as follows: Asset amounts as prepaid pension assets; (Liability) amounts as compensation
and benefits (current liability) and retirement and nonpension postretirement benefit obligations (noncurrent liability).
At December31, 2015, the company’s qualified defined benefit pension plans worldwide were 97percent funded compared to the benefit
obligations, with the U.S. Qualified PPP 101percent funded. Overall, including nonqualified plans, the company’s defined benefit pension
plans worldwide were 89percent funded.