IBM 2015 Annual Report Download - page 64
Download and view the complete annual report
Please find page 64 of the 2015 IBM annual report below. You can navigate through the pages in the report by either clicking on the pages listed below, or by using the keyword search tool below to find specific information within the annual report.-
 1
1 -
2
-
3
-
4
-
5
-
6
-
7
-
8
-
9
-
10
-
11
-
12
-
13
-
14
-
15
-
16
-
17
-
18
-
19
-
20
-
21
-
22
-
23
-
24
-
25
-
26
-
27
-
28
-
29
-
30
-
31
-
32
-
33
-
34
-
35
-
36
-
37
-
38
-
39
-
40
-
41
-
42
-
43
-
44
-
45
-
46
-
47
-
48
-
49
-
50
-
51
-
52
-
53
-
 54
54 -
 55
55 -
 56
56 -
 57
57 -
 58
58 -
 59
59 -
 60
60 -
 61
61 -
 62
62 -
 63
63 -
 64
64 -
 65
65 -
 66
66 -
 67
67 -
 68
68 -
 69
69 -
 70
70 -
 71
71 -
 72
72 -
 73
73 -
 74
74 -
75
-
76
-
77
-
78
-
79
-
80
-
81
-
82
-
83
-
84
-
85
-
86
-
87
-
88
-
89
-
90
-
91
-
92
-
93
-
94
-
95
-
96
-
97
-
98
-
99
-
100
-
101
-
102
-
103
-
104
-
105
-
106
-
107
-
108
-
109
-
110
-
111
-
112
-
113
-
114
-
115
-
116
-
117
-
118
-
119
-
120
-
121
-
122
-
123
-
124
-
125
-
126
-
127
-
128
-
129
-
130
-
131
-
132
-
133
-
134
-
135
-
136
-
137
-
138
-
139
-
140
-
141
-
142
-
143
-
144
-
145
-
146
-
147
-
148
-
149
-
150
-
151
-
152
-
153
-
154
-
155
-
156
 |
 |

62 Management Discussion
International Business Machines Corporation and Subsidiary Companies
Standard
& Poor’s
Moody’s
Investors
Service
Fitch
Ratings
Senior long-term debt AA- Aa3 A+
Commercial paper A-1+ Prime-1 F1
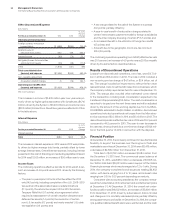
The company prepares its Consolidated Statement of Cash Flows
in accordance with applicable accounting standards for cash flow
presentation on page79 and highlights causes and events under-
lying sources and uses of cash in that format on page40. For the
purpose of running its business, the company manages, monitors
and analyzes cash flows in a different format.
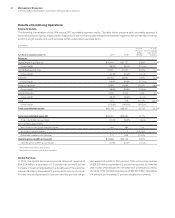
Management uses a free cash flow measure to evaluate the
company’s operating results, plan share repurchase levels, eval-
uate strategic investments and assess the company’s ability and
need to incur and service debt. Free cash flow is not a defined term
under GAAP and it should not be inferred that the entire free cash
flow amount is available for discretionary expenditures. The com-
pany defines free cash flow as net cash from operating activities
less the change in Global Financing receivables and net capital
expenditures, including the investment in software. A key objective
of the Global Financing business is to generate strong returns on
equity. Increasing receivables is the basis for growth in a financing
business. Accordingly, management considers Global Financing
receivables as a profit-generating investment, not as working
capital that should be minimized for efficiency. After considering
Global Financing receivables as an investment, the remaining net
operational cash flow less net capital expenditures is viewed by
the company as free cash flow.
From the perspective of how management views cash flow,
in 2015, after investing $3.8billion in capital investments primarily
in support of the growth in the services backlog and the build
out of cloud data centers, the company generated free cash flow
of $13.1billion, an increase of $0.7billion compared to 2014. The
increase was driven by a reduction in cash tax payments of $3.1bil-
lion, due primarily to a higher cash tax rate in 2014, and continued
improvement in sales cycle working capital ($1.2billion). This was
partially offset by performance-related declines in net income and
a higher level of payments for performance-based compensation
which was accrued in 2014.
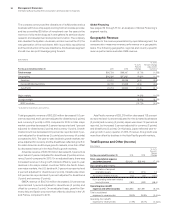
In 2015, the company continued to focus its cash utilization
on returning value to shareholders including $4.9billion in div-
idends and $4.6billion in gross common stock repurchases
(30.3million shares). In addition, $3.3billion was utilized for 14
acquisitions in 2015.
Over the past five years, the company generated over $75bil-
lion in free cash flow. During that period, the company invested
approximately $13billion in strategic acquisitions and returned
over $73billion to shareholders through dividends and net share
repurchases. The company’s performance during this period
demonstrates that there is fungibility across the elements of
share repurchases, dividends and acquisitions. The amount of
prospective returns to shareholders in the form of dividends and
share repurchases will vary based upon several factors including
each year’s operating results, capital expenditure requirements,
research and development investments and acquisitions, as well
as the factors discussed below.
The company’s Board of Directors meets quarterly to consider
the dividend payment. In the second quarter of 2015, the Board
of Directors increased the company’s quarterly common stock
dividend from $1.10 to $1.30 per share.
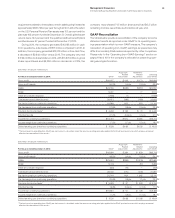
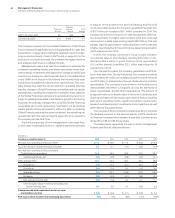
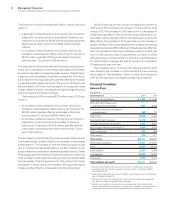
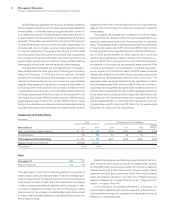
The table below represents the way in which management
reviews cash flow as described above.
($ inbillions)
For the year ended December 31: 2015 2014 2013 2012 2011
Net cash from operating activities per GAAP $17.0 $ 16.9 $ 17.5 $ 19.6 $ 19.8
Less: the change in Global Financing receivables 0.2 0.7 (1.3) (2.9) (0.8)
Net cash from operating activities, excluding
Global Financing receivables 16.9 16.2 18.8 22.5 20.7
Capital expenditures, net (3.8) (3.8) (3.8) (4.3) (4.1)
Free cash fl ow (FCF) 13.1 12.4 15.0 18.2 16.6
Acquisitions (3.3) (0.7) (3.1) (3.7) (1.8)
Divestitures (0.4) 2.4 0.3 0.6 0.0
Share repurchase (4.6) (13.7) (13.9) (12.0) (15.0)
Dividends (4.9) (4.3) (4.1) (3.8) (3.5)
Non-Global Financing debt (0.1) (1.3) 3.2 0.7 1.7
Other (includes Global Financing receivables and
Global Financing debt) 0.0 2.6 2.4 (0.8) 2.3
Change in cash, cash equivalents and short-term
marketable securities $ (0.3) $ (2.6) $ (0.1) $ (0.8) $ 0.3
FCF as percent of Income from Continuing Operations 98% 79% 89% 107% 103%