IBM 2015 Annual Report Download - page 60
Download and view the complete annual report
Please find page 60 of the 2015 IBM annual report below. You can navigate through the pages in the report by either clicking on the pages listed below, or by using the keyword search tool below to find specific information within the annual report.-
 1
1 -
2
-
3
-
4
-
5
-
6
-
7
-
8
-
9
-
10
-
11
-
12
-
13
-
14
-
15
-
16
-
17
-
18
-
19
-
20
-
21
-
22
-
23
-
24
-
25
-
26
-
27
-
28
-
29
-
30
-
31
-
32
-
33
-
34
-
35
-
36
-
37
-
38
-
39
-
40
-
41
-
42
-
43
-
44
-
45
-
46
-
47
-
48
-
49
-
 50
50 -
 51
51 -
 52
52 -
 53
53 -
 54
54 -
 55
55 -
 56
56 -
 57
57 -
 58
58 -
 59
59 -
 60
60 -
 61
61 -
 62
62 -
 63
63 -
 64
64 -
 65
65 -
 66
66 -
 67
67 -
 68
68 -
 69
69 -
 70
70 -
71
-
72
-
73
-
74
-
75
-
76
-
77
-
78
-
79
-
80
-
81
-
82
-
83
-
84
-
85
-
86
-
87
-
88
-
89
-
90
-
91
-
92
-
93
-
94
-
95
-
96
-
97
-
98
-
99
-
100
-
101
-
102
-
103
-
104
-
105
-
106
-
107
-
108
-
109
-
110
-
111
-
112
-
113
-
114
-
115
-
116
-
117
-
118
-
119
-
120
-
121
-
122
-
123
-
124
-
125
-
126
-
127
-
128
-
129
-
130
-
131
-
132
-
133
-
134
-
135
-
136
-
137
-
138
-
139
-
140
-
141
-
142
-
143
-
144
-
145
-
146
-
147
-
148
-
149
-
150
-
151
-
152
-
153
-
154
-
155
-
156
 |
 |

58 Management Discussion
International Business Machines Corporation and Subsidiary Companies
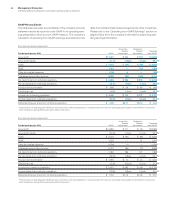
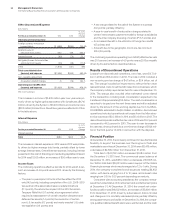
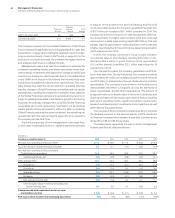
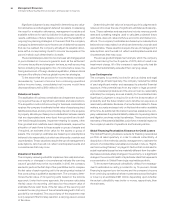
Other (Income) and Expense
($ inmillions)
For the year ended December 31: 2014 2013
Yr.-to-Yr.
Percent
Change
Other (income) and expense
Foreign currency transaction
losses/(gains) $ (599) $(260) 130.4%
(Gains)/losses on
derivative instruments 654 166 293.3
Interest income (90) (74) 22.1
Net (gains)/losses from securities
and investment assets (26) (29) (11.5)
Other (1,878) (137) NM
Total consolidated other
(income) and expense $(1,938) $(333) 482.4%
Non-operating adjustment
Acquisition-related charges (1) (16) (94.7)
Operating (non-GAAP) other
(income) and expense $(1,939) $(349) 456.2%
NM—Not meaningful
The increase in income of $1,605 million year over year was pri-
marily driven by higher gains associated with divestitures ($1,710
million), driven by the Systemx ($1,400 million) and customer care
($202million) transactions. Divestiture gains are reflected in Other
in the table above.
Interest Expense
($ inmillions)
For the year ended December 31: 2014 2013
Yr.-to-Yr.
Percent
Change
Interest expense
Total $484 $402 20.4%
The increase in interest expense in 2014 versus 2013 was primar-
ily driven by higher average debt levels, partially offset by lower
average interest rates. Overall interest expense, including interest
presented in the cost of financing, and excluding capitalized interest,
for 2014 was $1,025 million, an increase of $36million year to year.
Income Taxes
The continuing operations effective tax rate for 2014 was 21.2per-
cent, an increase of 4.6points versus 2013, driven by the following
factors:
• The year-to-year impact of factors that benefited the 2013
rate (14.5points), including completion of the U.S. 2008–2010
tax audit and the associated reserve redeterminations
(11.1points), the retroactive impact of the 2012 American
Taxpayer Relief Act (0.7points), a tax agreement which
required a reassessment of certain valuation allowances on
deferred tax assets (1.4points), the resolution of certain
non-U.S. tax audits (0.7points) and newly enacted U.S. state
tax legislation (0.6points); and
• A tax charge related to the sale of the Systemx business
(0.9points); partially offset by;
• A year-to-year benefit of reduced tax charges related to
certain intercompany payments made by foreign subsidiaries
and the intercompany licensing of certain IP (3.7points); and
• An increased benefit in the utilization of foreign tax credits
(4.7points); and
• A benefit due to the geographic mix of pre-tax income in
2014 (2.5points).
The continuing operations operating (non-GAAP) effective tax rate
was 21.0percent, an increase of 4.0points versus 2013 principally
driven by the same factors described above.
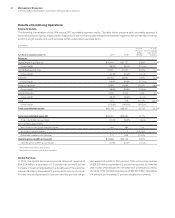
Results of Discontinued Operations
Losses from discontinued operations, net of tax, were $3.7bil-
lion in 2014 and $0.4billion in 2013. The loss in 2014 included a
non-recurring pre-tax charge of $4.7billion, or $3.4billion, net of
tax. The charge included an impairment to reflect the fair value
less estimated costs to sell the Microelectronics business, which
the company initially reported as held for sale at September30,
2014. The charge also included other estimated costs related
to the transaction, including cash consideration expected to be
transferred of approximately $1.5billion. The cash consideration is
expected to be paid over the next three years and will be adjusted
down by the amount of the working capital due from GLOBAL-
FOUNDRIES, estimated to be $0.2billion. In addition, discontinued
operations included operational net losses from the Microelec-
tronics business of $0.3billion in 2014 and $0.4billion in 2013. The
discontinued operations effective tax rate in 2014 was 30.2percent
compared to 44.8percent in 2013. The year-to-year decrease in
the rate was driven primarily by a one-time tax charge of $428mil-
lion in the third quarter of 2014 in connection with the disposal.
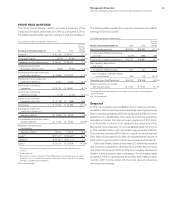
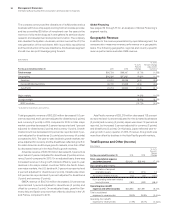
Financial Position
At December31, 2014, the company continued to have the financial
flexibility to support the business over the long term. Cash and
marketable securities at December31, 2014 were $8,476 million,
a decrease of $2,589 million from December31, 2013.
Total debt of $40,722 million increased $1,084 million from
the December31, 2013 level. The commercial paper balance at
December31, 2014, was $650million, a decrease of $1,808 mil-
lion. Within total debt, $29,103 million was in support of the Global
Financing business which was leveraged at a 7.2 to 1 ratio. During
2014, the company completed bond issuances totaling $6,852
million, with terms ranging from 2 to 10years, and interest rates
ranging from 0.30 to 3.63percent depending on maturity.
Consistent with accounting standards, the company remea-
sured the funded status of its retirement and postretirement plans
at December31. At December31, 2014, the overall net under-
funded position was $16,932 million, an increase of $5,498 million
from December31, 2013 driven by a decrease in discount rates
and changes in U.S. mortality rate assumptions, partially offset by
strong asset returns worldwide. At December31, 2014, the compa-
ny’s qualified defined benefit plans were well funded and the cash