IBM 2015 Annual Report Download - page 51
Download and view the complete annual report
Please find page 51 of the 2015 IBM annual report below. You can navigate through the pages in the report by either clicking on the pages listed below, or by using the keyword search tool below to find specific information within the annual report.-
 1
1 -
2
-
3
-
4
-
5
-
6
-
7
-
8
-
9
-
10
-
11
-
12
-
13
-
14
-
15
-
16
-
17
-
18
-
19
-
20
-
21
-
22
-
23
-
24
-
25
-
26
-
27
-
28
-
29
-
30
-
31
-
32
-
33
-
34
-
35
-
36
-
37
-
38
-
39
-
40
-
 41
41 -
 42
42 -
 43
43 -
 44
44 -
 45
45 -
 46
46 -
 47
47 -
 48
48 -
 49
49 -
 50
50 -
 51
51 -
 52
52 -
 53
53 -
 54
54 -
 55
55 -
 56
56 -
 57
57 -
 58
58 -
 59
59 -
 60
60 -
 61
61 -
62
-
63
-
64
-
65
-
66
-
67
-
68
-
69
-
70
-
71
-
72
-
73
-
74
-
75
-
76
-
77
-
78
-
79
-
80
-
81
-
82
-
83
-
84
-
85
-
86
-
87
-
88
-
89
-
90
-
91
-
92
-
93
-
94
-
95
-
96
-
97
-
98
-
99
-
100
-
101
-
102
-
103
-
104
-
105
-
106
-
107
-
108
-
109
-
110
-
111
-
112
-
113
-
114
-
115
-
116
-
117
-
118
-
119
-
120
-
121
-
122
-
123
-
124
-
125
-
126
-
127
-
128
-
129
-
130
-
131
-
132
-
133
-
134
-
135
-
136
-
137
-
138
-
139
-
140
-
141
-
142
-
143
-
144
-
145
-
146
-
147
-
148
-
149
-
150
-
151
-
152
-
153
-
154
-
155
-
156
 |
 |

49
Management Discussion
International Business Machines Corporation and Subsidiary Companies
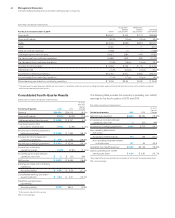
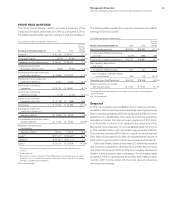
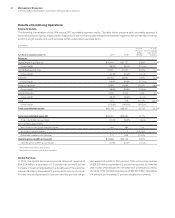
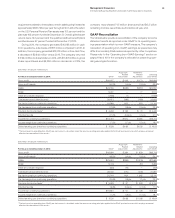
PRIOR YEAR IN REVIEW
The “Prior Year in Review” section provides a summary of the
company’s financial performance in 2014 as compared to 2013.
For additional information, see the company’s 2014 Annual Report.
($ and shares inmillions except per share amounts)
For the year ended December 31: 2014 2013
Yr.-to-Yr.
Percent/
Margin
Change
Revenue $ 92,793 $ 98,367 (5.7)%*
Gross profi t margin 50.0% 49.5% 0.5 pts.
Total expense and other (income) $ 26,421 $ 28,440 (7.1)%
Total expense and other
(income)-to-revenue ratio 28.5% 28.9%(0.4) pts.
Income before income taxes from
continuing operations $ 19,986 $ 20,244 (1.3)%
Provision for income taxes from
continuing operations 4,234 3,363 25.9%
Income from continuing
operations $ 15,751 $ 16,881 (6.7)%
Income from continuing
operations margin 17.0% 17.2%(0.2) pts.
Loss from discontinued
operations, net of tax $ (3,729) $ (398)NM
Net income $ 12,022 $ 16,483 (27.1)%
Earnings per share from
continuing operations:
Assuming dilution $ 15.59 $ 15.30 1.9%
Consolidated earnings per share—
assuming dilution $ 11.90 $ 14.94 (20.3)%
Weighted-average shares
outstanding:
Assuming dilution 1,010.0 1,103.0 (8.4)%
Assets** $117,271+$125,641+(6.7)%
Liabilities** $105,257+$102,711+2.5%
Equity** $ 12,014 $ 22,929 (47.6)%
*
(4.0)percent adjusted for currency; (1.5)percent adjusted for divestitures and
currency.
** At December31.
+ Reclassified to reflect adoption of the FASB guidance on deferred taxes and debt
issuance costs in consolidated financial statements. Refer to noteB, “Accounting
Changes,” for additional information.
NM—Not meaningful
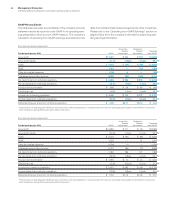
The following table provides the company’s operating (non-GAAP)
earnings for 2014 and 2013.
($ inmillions except per share amounts)
For the year ended December 31: 2014 2013
Yr.-to-Yr.
Percent
Change
Net income as reported $12,022 $16,483 (27.1)%
Loss from discontinued operations,
net of tax (3,729) (398) NM
Income from continuing operations $15,751 $16,881 (6.7)%
Non-operating adjustments
(net of tax)
Acquisition-related charges 670 747 (10.3)
Non-operating retirement-related
costs/(income) 280 729 (61.5)
Operating (non-GAAP) earnings* $16,702 $18,356 (9.0)%
Diluted operating (non-GAAP)
earnings per share $ 16.53 $ 16.64 (0.7)%
* See page59 for a more detailed reconciliation of net income to operating (non-
GAAP) earnings.
NM—Not meaningful
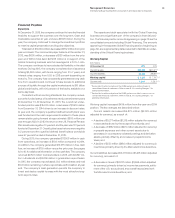
Snapshot
In 2014, the company reported $92.8billion in revenue, and deliv-
ered $20.0billion in pre-tax income and diluted earnings per share
from continuing operations of $15.59 as reported and $16.53 on an
operating (non-GAAP) basis. The results of continuing operations
excluded net losses from discontinued operations of $3.7billion
in 2014 and $0.4billion in 2013 related to the divestiture of the
Microelectronics business. On a consolidated basis, net income
in 2014 was $12.0billion, with diluted earnings per share of $11.90.
The company generated $16.9billion in cash from operations and
$12.4billion in free cash flow in 2014, driving shareholder returns of
$17.9billion in gross common stock repurchases and dividends.
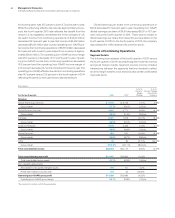
Total consolidated revenue decreased 5.7percent as reported
and 1percent adjusted for divestitures (3points) and currency
(2points) in 2014 versus 2013. In 2014, the company divested its
Systemx and customer care businesses. The company made
progress in 2014 in repositioning its portfolio and making invest-
ments to shift into the areas with the most value in enterprise
information technology.