IBM 2015 Annual Report Download - page 142
Download and view the complete annual report
Please find page 142 of the 2015 IBM annual report below. You can navigate through the pages in the report by either clicking on the pages listed below, or by using the keyword search tool below to find specific information within the annual report.-
 1
1 -
2
-
3
-
4
-
5
-
6
-
7
-
8
-
9
-
10
-
11
-
12
-
13
-
14
-
15
-
16
-
17
-
18
-
19
-
20
-
21
-
22
-
23
-
24
-
25
-
26
-
27
-
28
-
29
-
30
-
31
-
32
-
33
-
34
-
35
-
36
-
37
-
38
-
39
-
40
-
41
-
42
-
43
-
44
-
45
-
46
-
47
-
48
-
49
-
50
-
51
-
52
-
53
-
54
-
55
-
56
-
57
-
58
-
59
-
60
-
61
-
62
-
63
-
64
-
65
-
66
-
67
-
68
-
69
-
70
-
71
-
72
-
73
-
74
-
75
-
76
-
77
-
78
-
79
-
80
-
81
-
82
-
83
-
84
-
85
-
86
-
87
-
88
-
89
-
90
-
91
-
92
-
93
-
94
-
95
-
96
-
97
-
98
-
99
-
100
-
101
-
102
-
103
-
104
-
105
-
106
-
107
-
108
-
109
-
110
-
111
-
112
-
113
-
114
-
115
-
116
-
117
-
118
-
119
-
120
-
121
-
122
-
123
-
124
-
125
-
126
-
127
-
128
-
129
-
130
-
131
-
 132
132 -
 133
133 -
 134
134 -
 135
135 -
 136
136 -
 137
137 -
 138
138 -
 139
139 -
 140
140 -
 141
141 -
 142
142 -
 143
143 -
 144
144 -
 145
145 -
 146
146 -
 147
147 -
 148
148 -
 149
149 -
 150
150 -
 151
151 -
 152
152 -
153
-
154
-
155
-
156
 |
 |

Notes to Consolidated Financial Statements
International Business Machines Corporation and Subsidiary Companies
140
Defined Contribution Plans
The company contributed $1,117 million and $1,239 million in cash
to the defined contribution plans during the years ended Decem-
ber31, 2015 and 2014, respectively. In 2016, the company estimates
cash contributions to the defined contribution plans to be approx-
imately $1.1billion.
Nonpension Postretirement Benefit Plans
The company contributed $408million and $144million to the
nonpension postretirement benefit plans during the years ended
December31, 2015 and 2014, respectively. The $408million
contribution consisted of $328million in cash and $80million in
marketable securities in the form of U.S. Treasury securities. The
contribution of marketable securities is considered a non-cash
transaction in the Consolidated Statement of Cash Flows. These
contribution amounts exclude the Medicare-related subsidy dis-
cussed on page141.
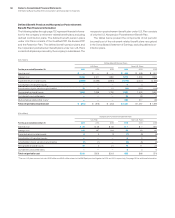
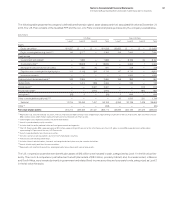
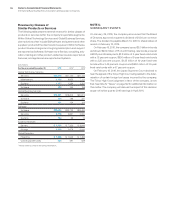
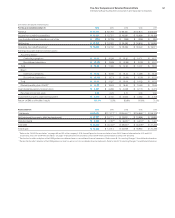
Expected Benefit Payments
Defined Benefit Pension Plan Expected Payments
The following table presents the total expected benefit payments
to defined benefit pension plan participants. These payments
have been estimated based on the same assumptions used to
measure the plans’ PBO at December31, 2015 and include ben-
efits attributable to estimated future compensation increases,
where applicable.
($ inmillions)
Qualifi ed
U.S. Plan
Payments
Nonqualifi ed
U.S. Plans
Payments
Qualifi ed
Non-U.S. Plans
Payments
Nonqualifi ed
Non-U.S. Plans
Payments
Tota l
Expected
Benefi t
Payments
2016 $ 3,513 $118 $1,756 $ 311 $ 5,698
2017 3,501 118 1,751 306 5,675
2018 3,501 120 1,780 313 5,714
2019 3,496 121 1,814 326 5,757
2020 3,548 122 1,857 341 5,868
2021–2025 17,279 604 9,855 1,888 29,625
The 2016 expected benefit payments to defined benefit pen-
sion plan participants not covered by the respective plan assets
(underfunded plans) represent a component of compensation and
benefits, within current liabilities, in the Consolidated Statement of
Financial Position.
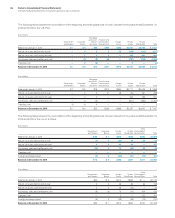
Nonpension Postretirement Benefit Plan Expected Payments
The following table reflects the total expected benefit payments to
nonpension postretirement benefit plan participants. These pay-
ments have been estimated based on the same assumptions used
to measure the plans’ APBO at December31, 2015.
($ inmillions)
U.S. Plan
Payments
Qualifi ed
Non-U.S. Plans
Payments
Nonqualifi ed
Non-U.S. Plans
Payments
Tota l
Expected
Benefi t
Payments
2016 $ 393 $ 5 $ 26 $ 424
2017 399 6 30 434
2018 401 6 33 439
2019 406 7 35 448
2020 401 7 39 447
2021–2025 1,797 49 240 2,087
The 2016 expected benefit payments to nonpension postretirement benefit plan participants not covered by the respective plan assets
represent a component of compensation and benefits, within current liabilities, in the Consolidated Statement of Financial Position.