IBM 2015 Annual Report Download - page 139
Download and view the complete annual report
Please find page 139 of the 2015 IBM annual report below. You can navigate through the pages in the report by either clicking on the pages listed below, or by using the keyword search tool below to find specific information within the annual report.-
 1
1 -
2
-
3
-
4
-
5
-
6
-
7
-
8
-
9
-
10
-
11
-
12
-
13
-
14
-
15
-
16
-
17
-
18
-
19
-
20
-
21
-
22
-
23
-
24
-
25
-
26
-
27
-
28
-
29
-
30
-
31
-
32
-
33
-
34
-
35
-
36
-
37
-
38
-
39
-
40
-
41
-
42
-
43
-
44
-
45
-
46
-
47
-
48
-
49
-
50
-
51
-
52
-
53
-
54
-
55
-
56
-
57
-
58
-
59
-
60
-
61
-
62
-
63
-
64
-
65
-
66
-
67
-
68
-
69
-
70
-
71
-
72
-
73
-
74
-
75
-
76
-
77
-
78
-
79
-
80
-
81
-
82
-
83
-
84
-
85
-
86
-
87
-
88
-
89
-
90
-
91
-
92
-
93
-
94
-
95
-
96
-
97
-
98
-
99
-
100
-
101
-
102
-
103
-
104
-
105
-
106
-
107
-
108
-
109
-
110
-
111
-
112
-
113
-
114
-
115
-
116
-
117
-
118
-
119
-
120
-
121
-
122
-
123
-
124
-
125
-
126
-
127
-
128
-
 129
129 -
 130
130 -
 131
131 -
 132
132 -
 133
133 -
 134
134 -
 135
135 -
 136
136 -
 137
137 -
 138
138 -
 139
139 -
 140
140 -
 141
141 -
 142
142 -
 143
143 -
 144
144 -
 145
145 -
 146
146 -
 147
147 -
 148
148 -
 149
149 -
150
-
151
-
152
-
153
-
154
-
155
-
156
 |
 |

Notes to Consolidated Financial Statements
International Business Machines Corporation and Subsidiary Companies
137
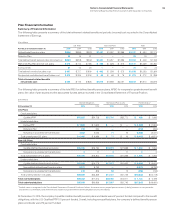
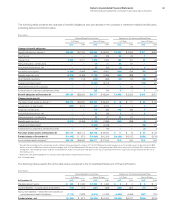
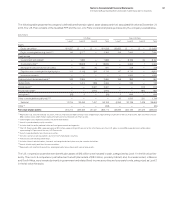
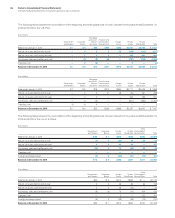
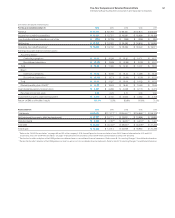
The following table presents the company’s defined benefit pension plans’ asset classes and their associated fair value at December31,
2014. The U.S. Plan consists of the Qualified PPP and the non-U.S. Plans consist of all plans sponsored by the company’s subsidiaries.
($ inmillions)
U.S. Plan Non-U.S. Plans
Level 1 Level 2 Level 3 Total Level 1 Level 2 Level 3 Total
Equity
Equity securities
(1) $11,527 $ 1 $ — $11,528 $5,652 $ — $ — $ 5,652
Equity commingled/mutual funds
(2) (3) 85 2,277 — 2,362 126 7,415 — 7,540
Fixed income
Government and related
(4) — 7,883 — 7,883 — 8,159 32 8,191
Corporate bonds
(5) — 18,828 4 18,832 — 2,063 1 2,063
Mortgage and asset-backed securities — 567 20 587 — 238 — 238
Fixed income commingled/mutual funds
(2) (6) 312 3,118 295 3,725 87 9,715 — 9,802
Insurance contracts —————1,053 — 1,053
Cash and short-term investments
(7) 345 2,304 — 2,650 158 393 — 551
Hedge funds — 1,474 889 2,362 — 745 — 745
Private equity
(8) — — 3,287 3,287 — — 513 513
Private real estate
(8) — — 2,942 2,942 — — 664 664
Derivatives
(9) (55) 3 — (53) 2 846 — 848
Other commingled/mutual funds
(2) (10) ————331,513 220 1,766
Subtotal 12,214 36,455 7,437 56,106 6,056 32,139 1,429 39,625
Other
(11) — — — (333) — — — (82)
Fair value of plan assets $12,214 $36,455 $7,437 $55,772 $6,056 $32,139 $1,429 $39,543
(1) Represents U.S. and international securities. The U.S. Plan includes IBM common stock of $55million, representing 0.1percent of the U.S. Plan assets. Non-U.S. Plans include
IBM common stock of $21million, representing 0.1percent of the non-U.S. Plans assets.
(2) Commingled funds represent pooled institutional investments.
(3) Invests in predominantly equity securities.
(4) Includes debt issued by national, state and local governments and agencies.
(5) The U.S. Plan includes IBM corporate bonds of $10million, representing 0.02percent of the U.S. Plan assets. Non-U.S. plans include IBM corporate bonds of $4million
representing 0.01percent of the non-U.S. Plan assets.
(6) Invests in predominantly fixed-income securities.
(7) Includes cash and cash equivalents and short-term marketable securities.
(8) Primarily includes limited partnerships.
(9) Includes interest rate derivatives, forwards, exchange traded and other over-the-counter derivatives.
(10) Invests in both equity and fixed-income securities.
(11) Represents net unsettled transactions, relating primarily to purchases and sales of plan assets.
The U.S. nonpension postretirement benefit plan assets of $16million were invested in cash, categorized as Level1 in the fair value hier-
archy. The non-U.S. nonpension postretirement benefit plan assets of $84million, primarily in Brazil, and, to a lesser extent, in Mexico
and South Africa, were invested primarily in government and related fixed-income securities and corporate bonds, categorized as Level2
in the fair value hierarchy.