IBM 2015 Annual Report Download - page 137
Download and view the complete annual report
Please find page 137 of the 2015 IBM annual report below. You can navigate through the pages in the report by either clicking on the pages listed below, or by using the keyword search tool below to find specific information within the annual report.-
 1
1 -
2
-
3
-
4
-
5
-
6
-
7
-
8
-
9
-
10
-
11
-
12
-
13
-
14
-
15
-
16
-
17
-
18
-
19
-
20
-
21
-
22
-
23
-
24
-
25
-
26
-
27
-
28
-
29
-
30
-
31
-
32
-
33
-
34
-
35
-
36
-
37
-
38
-
39
-
40
-
41
-
42
-
43
-
44
-
45
-
46
-
47
-
48
-
49
-
50
-
51
-
52
-
53
-
54
-
55
-
56
-
57
-
58
-
59
-
60
-
61
-
62
-
63
-
64
-
65
-
66
-
67
-
68
-
69
-
70
-
71
-
72
-
73
-
74
-
75
-
76
-
77
-
78
-
79
-
80
-
81
-
82
-
83
-
84
-
85
-
86
-
87
-
88
-
89
-
90
-
91
-
92
-
93
-
94
-
95
-
96
-
97
-
98
-
99
-
100
-
101
-
102
-
103
-
104
-
105
-
106
-
107
-
108
-
109
-
110
-
111
-
112
-
113
-
114
-
115
-
116
-
117
-
118
-
119
-
120
-
121
-
122
-
123
-
124
-
125
-
126
-
 127
127 -
 128
128 -
 129
129 -
 130
130 -
 131
131 -
 132
132 -
 133
133 -
 134
134 -
 135
135 -
 136
136 -
 137
137 -
 138
138 -
 139
139 -
 140
140 -
 141
141 -
 142
142 -
 143
143 -
 144
144 -
 145
145 -
 146
146 -
 147
147 -
148
-
149
-
150
-
151
-
152
-
153
-
154
-
155
-
156
 |
 |
Notes to Consolidated Financial Statements
International Business Machines Corporation and Subsidiary Companies
135
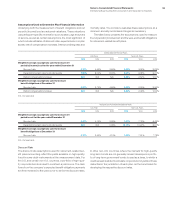
Healthcare Cost Trend Rate
For nonpension postretirement benefit plan accounting, the
company reviews external data and its own historical trends for
healthcare costs to determine the healthcare cost trend rates.
However, the healthcare cost trend rate has an insignificant effect
on plan costs and obligations as a result of the terms of the plan
which limit the company’s obligation to the participants. The com-
pany assumes that the healthcare cost trend rate for 2016 will be
7percent. In addition, the company assumes that the same trend
rate will decrease to 5percent over the next eight years. A one
percentage point increase or decrease in the assumed health-
care cost trend rate would not have had a material effect on 2015,
2014 and 2013 net periodic cost or the benefit obligations as of
December31, 2015 and 2014.
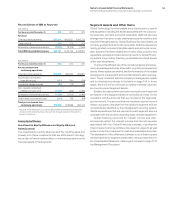
Plan Assets
Retirement-related benefit plan assets are recognized and
measured at fair value. Because of the inherent uncertainty of
valuations, these fair value measurements may not necessarily
reflect the amounts the company could realize in current market
transactions.
Investment Policies and Strategies
The investment objectives of the Qualified PPP portfolio are
designed to generate returns that will enable the plan to meet
its future obligations. The precise amount for which these obli-
gations will be settled depends on future events, including the
retirement dates and life expectancy of the plans’ participants.
The obligations are estimated using actuarial assumptions, based
on the current economic environment and other pertinent factors
described on pages 133 through 134. The Qualified PPP portfolio’s
investment strategy balances the requirement to generate returns,
using potentially higher yielding assets such as equity securities,
with the need to control risk in the portfolio with less volatile assets,
such as fixed-income securities. Risks include, among others,
inflation, volatility in equity values and changes in interest rates that
could cause the plan to become underfunded, thereby increasing
its dependence on contributions from the company. To mitigate
any potential concentration risk, careful consideration is given to
balancing the portfolio among industry sectors, companies and
geographies, taking into account interest rate sensitivity, depen-
dence on economic growth, currency and other factors that affect
investment returns. In 2014, the company changed its investment
strategy, modifying the target asset allocation, primarily by reduc-
ing equity securities and increasing debt securities. This change
was designed to reduce the potential negative impact that equity
markets might have on the funded status of the plan. The Qualified
PPP portfolio’s target allocation is 34percent equity securities,
56percent fixed-income securities, 5percent real estate and
5percent other investments.
The assets are managed by professional investment firms
and investment professionals who are employees of the com-
pany. They are bound by investment mandates determined by
the company’s management and are measured against specific
benchmarks. Among these managers, consideration is given, but
not limited to, balancing security concentration, issuer concentra-
tion, investment style and reliance on particular active and passive
investment strategies.
Market liquidity risks are tightly controlled, with $5,219 million
of the Qualified PPP portfolio as of December 31, 2015 invested
in private market assets consisting of private equities and private
real estate investments, which are less liquid than publicly traded
securities. In addition, the Qualified PPP portfolio had $2,547 mil-
lion in commitments for future investments in private markets to be
made over a number of years. These commitments are expected
to be funded from plan assets.
Derivatives are used as an effective means to achieve
investment objectives and/or as a component of the plan’s risk
management strategy. The primary reasons for the use of deriv-
atives are fixed income management, including duration, interest
rate management and credit exposure, cash equitization and to
manage currency and commodity strategies.
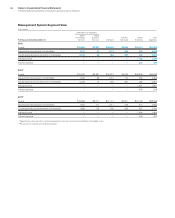
Outside the U.S., the investment objectives are similar to those
described above, subject to local regulations. The weighted-av-
erage target allocation for the non-U.S. plans is 29percent equity
securities, 58percent fixed-income securities, 2percent real
estate and 11percent other investments, which is consistent with
the allocation decisions made by the company’s management.
The table on page136 details the actual equity, fixed income,
real estate and other types of investments for non-U.S. plans. In
some countries, a higher percentage allocation to fixed income
is required to manage solvency and funding risks. In others, the
responsibility for managing the investments typically lies with a
board that may include up to 50percent of members elected
by employees and retirees. This can result in slight differences
compared with the strategies previously described. Generally,
these non-U.S. plans do not invest in illiquid assets and their use
of derivatives is consistent with the U.S. plan and mainly for cur-
rency hedging, interest rate risk management, credit exposure and
alternative investment strategies.
The company’s nonpension postretirement benefit plans are
underfunded or unfunded. For some plans, the company main-
tains a nominal, highly liquid trust fund balance to ensure timely
benefit payments.