IBM 2015 Annual Report Download - page 114
Download and view the complete annual report
Please find page 114 of the 2015 IBM annual report below. You can navigate through the pages in the report by either clicking on the pages listed below, or by using the keyword search tool below to find specific information within the annual report.-
 1
1 -
2
-
3
-
4
-
5
-
6
-
7
-
8
-
9
-
10
-
11
-
12
-
13
-
14
-
15
-
16
-
17
-
18
-
19
-
20
-
21
-
22
-
23
-
24
-
25
-
26
-
27
-
28
-
29
-
30
-
31
-
32
-
33
-
34
-
35
-
36
-
37
-
38
-
39
-
40
-
41
-
42
-
43
-
44
-
45
-
46
-
47
-
48
-
49
-
50
-
51
-
52
-
53
-
54
-
55
-
56
-
57
-
58
-
59
-
60
-
61
-
62
-
63
-
64
-
65
-
66
-
67
-
68
-
69
-
70
-
71
-
72
-
73
-
74
-
75
-
76
-
77
-
78
-
79
-
80
-
81
-
82
-
83
-
84
-
85
-
86
-
87
-
88
-
89
-
90
-
91
-
92
-
93
-
94
-
95
-
96
-
97
-
98
-
99
-
100
-
101
-
102
-
103
-
 104
104 -
 105
105 -
 106
106 -
 107
107 -
 108
108 -
 109
109 -
 110
110 -
 111
111 -
 112
112 -
 113
113 -
 114
114 -
 115
115 -
 116
116 -
 117
117 -
 118
118 -
 119
119 -
 120
120 -
 121
121 -
 122
122 -
 123
123 -
 124
124 -
125
-
126
-
127
-
128
-
129
-
130
-
131
-
132
-
133
-
134
-
135
-
136
-
137
-
138
-
139
-
140
-
141
-
142
-
143
-
144
-
145
-
146
-
147
-
148
-
149
-
150
-
151
-
152
-
153
-
154
-
155
-
156
 |
 |

Notes to Consolidated Financial Statements
International Business Machines Corporation and Subsidiary Companies
112
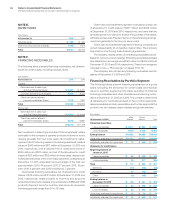
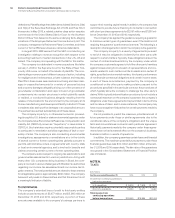
Long-Term Debt
Pre-Swap Borrowing
($ inmillions)
At December 31: Maturities 2015 2014
U.S. dollar notes and debentures (average interest rate at December 31, 2015):
2.80% 2016 – 2017 $ 9,351 $ 9,254
3.34% 2018 – 2019 7,591 6,835
1.46% 2020 –2021 3,717 6,555
2.35% 2022 1,900 1,000
3.38% 2023 1,500 1,500
3.63% 2024 2,000 2,000
7.00% 2025 600 600
6.22% 2027 469 469
6.50% 2028 313 313
5.88% 2032 600 600
8.00% 2038 83 83
5.60% 2039 745 745
4.00% 2042 1,107 1,107
7.00% 2045 27 27
7.13% 2096 316 316
30,319 31,404
Other currencies (average interest rate at December 31, 2015, in parentheses):
Euros (1.8%) 2016 – 2025 4,892 5,463
Pound sterling (2.7%) 2017 – 2022 1,555 1,176
Japanese yen (0.4%) 2017 – 2022 1,180 733
Swiss francs (6.3%) 2020 9162
Canadian (2.2%) 2017 360 432
Other (13.8%) 2016– 2020 506 367
38,820 39,737
Less: net unamortized discount 838 853
Less: net unamortized debt issuance costs 74 83**
Add: fair value adjustment* 790 792
38,699 39,593**
Less: current maturities 5,271 4,601**
Total $33,428 $34,991 **
* The portion of the company’s fixed-rate debt obligations that is hedged is reflected in the Consolidated Statement of Financial Position as an amount equal to the sum of the
debt’s carrying value plus a fair value adjustment representing changes in the fair value of the hedged debt obligations attributable to movements in benchmark interest rates.
** Reclassified to reflect adoption of the FASB guidance on debt issuance costs in consolidated financial statements. Refer to noteB, “Accounting Changes,” for additional information.