IBM 2015 Annual Report Download - page 146
Download and view the complete annual report
Please find page 146 of the 2015 IBM annual report below. You can navigate through the pages in the report by either clicking on the pages listed below, or by using the keyword search tool below to find specific information within the annual report.-
 1
1 -
2
-
3
-
4
-
5
-
6
-
7
-
8
-
9
-
10
-
11
-
12
-
13
-
14
-
15
-
16
-
17
-
18
-
19
-
20
-
21
-
22
-
23
-
24
-
25
-
26
-
27
-
28
-
29
-
30
-
31
-
32
-
33
-
34
-
35
-
36
-
37
-
38
-
39
-
40
-
41
-
42
-
43
-
44
-
45
-
46
-
47
-
48
-
49
-
50
-
51
-
52
-
53
-
54
-
55
-
56
-
57
-
58
-
59
-
60
-
61
-
62
-
63
-
64
-
65
-
66
-
67
-
68
-
69
-
70
-
71
-
72
-
73
-
74
-
75
-
76
-
77
-
78
-
79
-
80
-
81
-
82
-
83
-
84
-
85
-
86
-
87
-
88
-
89
-
90
-
91
-
92
-
93
-
94
-
95
-
96
-
97
-
98
-
99
-
100
-
101
-
102
-
103
-
104
-
105
-
106
-
107
-
108
-
109
-
110
-
111
-
112
-
113
-
114
-
115
-
116
-
117
-
118
-
119
-
120
-
121
-
122
-
123
-
124
-
125
-
126
-
127
-
128
-
129
-
130
-
131
-
132
-
133
-
134
-
135
-
 136
136 -
 137
137 -
 138
138 -
 139
139 -
 140
140 -
 141
141 -
 142
142 -
 143
143 -
 144
144 -
 145
145 -
 146
146 -
 147
147 -
 148
148 -
 149
149 -
 150
150 -
 151
151 -
 152
152 -
 153
153 -
 154
154 -
 155
155 -
 156
156
 |
 |
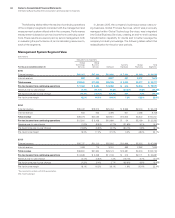
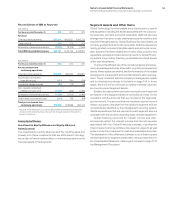
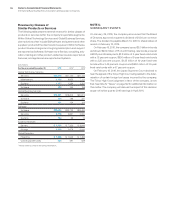
Notes to Consolidated Financial Statements
International Business Machines Corporation and Subsidiary Companies
144
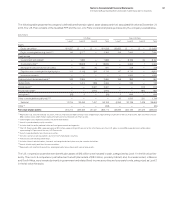
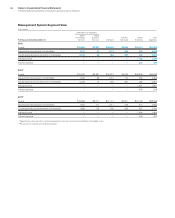
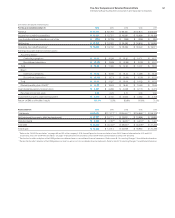
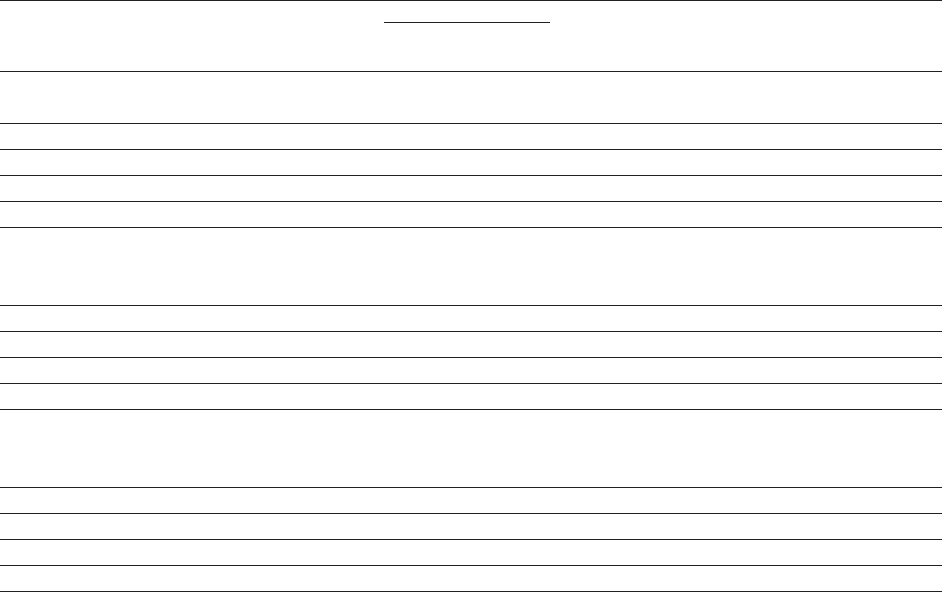
Management System Segment View
($ inmillions)
Global Services Segments
For the year ended December 31:
Global
Techn olo gy
Services
Global
Business
Services Software
Systems
Hardware
Global
Financing
Tota l
Segments
2015
Assets $16,960 $8,327 $26,585 $3,969 $36,157 $91,999
Depreciation/amortization of intangibles* 1,811 81 1,071 304 343 3,610
Capital expenditures/investments in intangibles 2,514 86 583 291 356 3,830
Interest income ————1,720 1,720
Interest expense ————469469
2014**
Assets $16,209 $8,831 $25,813 $4,235 $38,845 $93,933
Depreciation/amortization of intangibles* 1,833 98 1,210 712 455 4,308
Capital expenditures/investments in intangibles 2,226 79 534 600 482 3,921
Interest income ————1,951 1,951
Interest expense ————518518
2013**
Assets $16,658 $9,701 $27,101 $4,901 $40,138 $98,499
Depreciation/amortization of intangibles* 1,625 117 1,211 435 574 3,963
Capital expenditures/investments in intangibles 1,889 118 540 395 467 3,410
Interest income ————1,904 1,904
Interest expense ————405405
*
Segment pre-tax income from continuing operations does not include the amortization of intangible assets.
** Reclassified to conform with 2015 presentation.