IBM 2015 Annual Report Download - page 41
Download and view the complete annual report
Please find page 41 of the 2015 IBM annual report below. You can navigate through the pages in the report by either clicking on the pages listed below, or by using the keyword search tool below to find specific information within the annual report.-
 1
1 -
2
-
3
-
4
-
5
-
6
-
7
-
8
-
9
-
10
-
11
-
12
-
13
-
14
-
15
-
16
-
17
-
18
-
19
-
20
-
21
-
22
-
23
-
24
-
25
-
26
-
27
-
28
-
29
-
30
-
 31
31 -
 32
32 -
 33
33 -
 34
34 -
 35
35 -
 36
36 -
 37
37 -
 38
38 -
 39
39 -
 40
40 -
 41
41 -
 42
42 -
 43
43 -
 44
44 -
 45
45 -
 46
46 -
 47
47 -
 48
48 -
 49
49 -
 50
50 -
 51
51 -
52
-
53
-
54
-
55
-
56
-
57
-
58
-
59
-
60
-
61
-
62
-
63
-
64
-
65
-
66
-
67
-
68
-
69
-
70
-
71
-
72
-
73
-
74
-
75
-
76
-
77
-
78
-
79
-
80
-
81
-
82
-
83
-
84
-
85
-
86
-
87
-
88
-
89
-
90
-
91
-
92
-
93
-
94
-
95
-
96
-
97
-
98
-
99
-
100
-
101
-
102
-
103
-
104
-
105
-
106
-
107
-
108
-
109
-
110
-
111
-
112
-
113
-
114
-
115
-
116
-
117
-
118
-
119
-
120
-
121
-
122
-
123
-
124
-
125
-
126
-
127
-
128
-
129
-
130
-
131
-
132
-
133
-
134
-
135
-
136
-
137
-
138
-
139
-
140
-
141
-
142
-
143
-
144
-
145
-
146
-
147
-
148
-
149
-
150
-
151
-
152
-
153
-
154
-
155
-
156
 |
 |

39
Management Discussion
International Business Machines Corporation and Subsidiary Companies
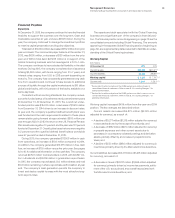
Financial Position
Dynamics
At December31, 2015, the company continued to have the financial
flexibility to support the business over the long term. Cash and
marketable securities at year end were $8,195 million. During the
year, the company continued to manage the investment portfolio
to meet its capital preservation and liquidity objectives.
Total debt of $39,890 million decreased $832million from prior
year-end levels. The commercial paper balance at December31,
2015, was $600million, a decrease of $50million from the prior
year end. Within total debt, $27,205 million is in support of the
Global Financing business which is leveraged at a 7.3 to 1 ratio.
The company continues to have substantial flexibility in the debt
markets. During 2015, the company completed bond issuances
totaling $3,368 million, with terms ranging from 3 to 7years, and
interest rates ranging from 0.53 to 2.88percent depending on
maturity. The company has consistently generated strong cash
flow from operations and continues to have access to additional
sources of liquidity through the capital markets and its $10billion
global credit facility, with 100percent of the facility available on a
same day basis.
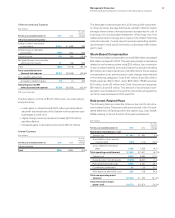
Consistent with accounting standards, the company remea-
sures the funded status of its retirement and postretirement plans
at December31. At December31, 2015, the overall net under-
funded position was $15,513 million, a decrease of $1,419 million
from December31, 2014 driven by an increase in discount rates.
At year end, the company’s qualified defined benefit plans were
well funded and the cash requirements related to these plans
remain stable going forward at approximately $500million per
year through 2020. In 2015, the return on the U.S. Personal Pension
Plan assets was negative 1.0percent and the plan was 101percent
funded at December31. Overall, global asset returns were negative
0.2percent and the qualified defined benefit plans worldwide
were 97percent funded at December31, 2015.
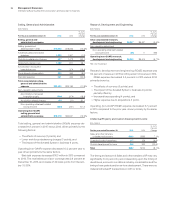
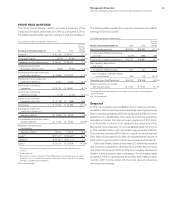
During 2015, the company generated $17,008 million in cash
from operations, an increase of $139million compared to 2014.
In addition, the company generated $13,075 million in free cash
flow, an increase of $703million versus the prior year. See pages
62 to 63 for additional information on free cash flow. The company
returned $9,507 million to shareholders in 2015, with $4,897 mil-
lion in dividends and $4,609 million in gross share repurchases.
In 2015, the company repurchased 30.3million shares and had
$5.6billion remaining in share repurchase authorization at year
end. The company’s cash generation permits the company to
invest and deploy capital to areas with the most attractive long-
term opportunities.
The assets and debt associated with the Global Financing
business are a significant part of the company’s financial posi-
tion. The financial position amounts appearing on page78 are the
consolidated amounts including Global Financing. The amounts
appearing in the separate Global Financing section, beginning on
page69, are supplementary data presented to facilitate an under-
standing of the Global Financing business.
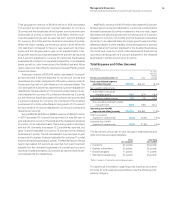
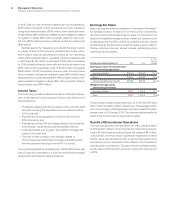
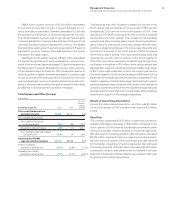
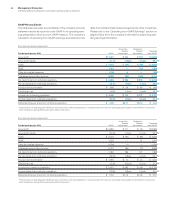
Working Capital
($ inmillions)
At December 31: 2015 2014
Current assets $42,504 $47,377*
Current liabilities 34,269 39,581* **
Working capital $ 8,235 $ 7,797* **
Current ratio 1.24:1 1.20:1* **
* Reclassified to reflect adoption of the FASB guidance on deferred taxes in
consolidated financial statements. Refer to noteB, “Accounting Changes,” for
additional information.
** Reclassified to reflect adoption of the FASB guidance on debt issuance costs in
consolidated financial statements. Refer to noteB, “Accounting Changes,” for
additional information.
Working capital increased $439million from the year-end 2014
position. The key changes are described below:
Current assets decreased $4,873 million ($2,074 million
adjusted for currency), as a result of:
• A decline of $3,277 million ($1,316 million adjusted for currency)
in receivables driven by the receipt of tax refunds; and
• A decrease of $762million ($470million adjusted for currency)
in prepaid expenses and other current assets due to
decreases in counterparty collateral postings and derivative
assets, partially offset by an increase in prepaid income
taxes; and
• A decline of $553million ($480million adjusted for currency) in
inventories primarily driven by the Microelectronics divestiture.
Current liabilities decreased $5,311 million ($3,418 million adjusted
for currency), as a result of:
• A decrease in taxes of $2,237 million ($1,995 million adjusted
for currency) primarily driven by income tax payments, settle-
ment of the U.S. tax audit and a tax benefit associated with
the Microelectronics divestiture; and