IBM 2015 Annual Report Download - page 43
Download and view the complete annual report
Please find page 43 of the 2015 IBM annual report below. You can navigate through the pages in the report by either clicking on the pages listed below, or by using the keyword search tool below to find specific information within the annual report.-
 1
1 -
2
-
3
-
4
-
5
-
6
-
7
-
8
-
9
-
10
-
11
-
12
-
13
-
14
-
15
-
16
-
17
-
18
-
19
-
20
-
21
-
22
-
23
-
24
-
25
-
26
-
27
-
28
-
29
-
30
-
31
-
32
-
 33
33 -
 34
34 -
 35
35 -
 36
36 -
 37
37 -
 38
38 -
 39
39 -
 40
40 -
 41
41 -
 42
42 -
 43
43 -
 44
44 -
 45
45 -
 46
46 -
 47
47 -
 48
48 -
 49
49 -
 50
50 -
 51
51 -
 52
52 -
 53
53 -
54
-
55
-
56
-
57
-
58
-
59
-
60
-
61
-
62
-
63
-
64
-
65
-
66
-
67
-
68
-
69
-
70
-
71
-
72
-
73
-
74
-
75
-
76
-
77
-
78
-
79
-
80
-
81
-
82
-
83
-
84
-
85
-
86
-
87
-
88
-
89
-
90
-
91
-
92
-
93
-
94
-
95
-
96
-
97
-
98
-
99
-
100
-
101
-
102
-
103
-
104
-
105
-
106
-
107
-
108
-
109
-
110
-
111
-
112
-
113
-
114
-
115
-
116
-
117
-
118
-
119
-
120
-
121
-
122
-
123
-
124
-
125
-
126
-
127
-
128
-
129
-
130
-
131
-
132
-
133
-
134
-
135
-
136
-
137
-
138
-
139
-
140
-
141
-
142
-
143
-
144
-
145
-
146
-
147
-
148
-
149
-
150
-
151
-
152
-
153
-
154
-
155
-
156
 |
 |

41
Management Discussion
International Business Machines Corporation and Subsidiary Companies
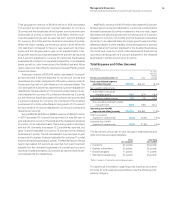
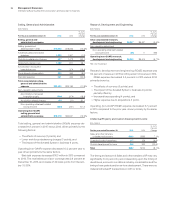
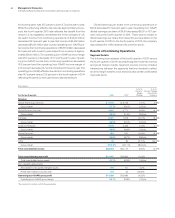
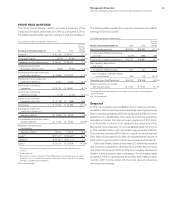
Debt
The company’s funding requirements are continually monitored
and strategies are executed to manage the overall asset and liabil-
ity profile. Additionally, the company maintains sufficient flexibility
to access global funding sources as needed.
($ inmillions)
At December 31: 2015 2014
Total company debt $39,890 $40,722*
Total Global Financing segment debt $27,205 $29,103
Debt to support external clients 23,934 25,531
Debt to support internal clients 3,271 3,572
Non-Global Financing debt 12,684 11,619*
* Reclassified to reflect adoption of the FASB guidance on debt issuance costs in
consolidated financial statements. Refer to noteB, “Accounting Changes,” for
additional information.
Global Financing provides financing predominantly for the com-
pany’s external client assets, as well as for assets under contract
by other IBM units. These assets, primarily for Global Services,
generate long-term, stable revenue streams similar to the Global
Financing asset portfolio. Based on their attributes, these Global
Services assets are leveraged with the balance of the Global
Financing asset base. The debt analysis above is further detailed
in the Global Financing section on pages 72 and 73.
Given the significant leverage, the company presents a
debt-to-capitalization ratio which excludes Global Financing debt
and equity as management believes this is more representative
of the company’s core business operations. This ratio can vary
from period to period as the company manages its global cash
and debt positions. “Core” debt-to-capitalization ratio (excluding
Global Financing debt and equity) was 54.3percent at Decem-
ber31, 2015 compared to 59.2percent at December31, 2014.
Consolidated debt-to-capitalization ratio at December31, 2015
was 73.4percent versus 77.2percent at December31, 2014.
Equity
Total equity increased by $2,410 million from December31, 2014
as a result of an increase in retained earnings of $8,332 million and
common stock of $596million offset by an increase in treasury
stock of $4,803 million mainly due to gross common stock repur-
chases and an increase in other comprehensive losses of $1,731
million primarily due to foreign currency translation adjustments.
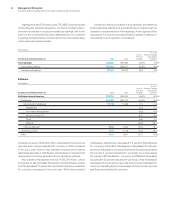
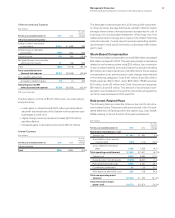
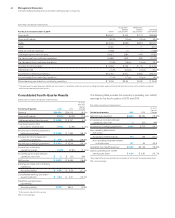
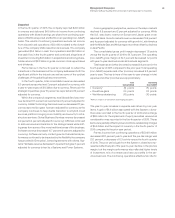
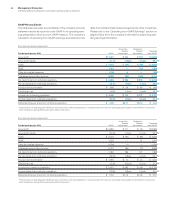
GAAP Reconciliation
The tables below provide a reconciliation of the company’s income
statement results as reported under GAAP to its operating earn-
ings presentation which is a non-GAAP measure. The company’s
calculation of operating (non-GAAP) earnings, as presented, may
differ from similarly titled measures reported by other companies.
Please refer to the “Operating (non-GAAP) Earnings” section on
pages 18 and 19 for the company’s rationale for presenting oper-
ating earnings information.
($ inmillions except per share amount)
For the year ended December 31, 2015: GAAP
Acquisition-
Related
Adjustments
Retirement-
Related
Adjustments
Operating
(non-GAAP)
Gross profi t $40,684 $ 373 $ 469 $41,526
Gross profi t margin 49.8% 0.5 pts. 0.6 pts. 50.8%
SG&A $20,430 $(324) $ (533) $19,573
RD&E 5,247 — (48) 5,200
Other (income) and expense (724) (5) — (729)
Total expense and other (income) 24,740 (330) (581) 23,830
Pre-tax income from continuing operations 15,945 703 1,050 17,697
Pre-tax margin from continuing operations 19.5% 0.9 pts. 1.3 pts. 21.6%
Provision for income taxes* $ 2,581 $ 141 $ 316 $ 3,037
Effective tax rate 16.2% 0.2 pts. 0.9 pts. 17.2%
Income from continuing operations $13,364 $ 562 $ 734 $14,659
Income margin from continuing operations 16.3% 0.7 pts. 0.9 pts. 17.9%
Diluted earnings per share from continuing operations $ 13.60 $0.57 $ 0.75 $ 14.92
* The tax impact on operating (non-GAAP) pre-tax income is calculated under the same accounting principles applied to the GAAP pre-tax income which employs an annual
effective tax rate method to the results.