IBM 2015 Annual Report Download - page 150
Download and view the complete annual report
Please find page 150 of the 2015 IBM annual report below. You can navigate through the pages in the report by either clicking on the pages listed below, or by using the keyword search tool below to find specific information within the annual report.-
 1
1 -
2
-
3
-
4
-
5
-
6
-
7
-
8
-
9
-
10
-
11
-
12
-
13
-
14
-
15
-
16
-
17
-
18
-
19
-
20
-
21
-
22
-
23
-
24
-
25
-
26
-
27
-
28
-
29
-
30
-
31
-
32
-
33
-
34
-
35
-
36
-
37
-
38
-
39
-
40
-
41
-
42
-
43
-
44
-
45
-
46
-
47
-
48
-
49
-
50
-
51
-
52
-
53
-
54
-
55
-
56
-
57
-
58
-
59
-
60
-
61
-
62
-
63
-
64
-
65
-
66
-
67
-
68
-
69
-
70
-
71
-
72
-
73
-
74
-
75
-
76
-
77
-
78
-
79
-
80
-
81
-
82
-
83
-
84
-
85
-
86
-
87
-
88
-
89
-
90
-
91
-
92
-
93
-
94
-
95
-
96
-
97
-
98
-
99
-
100
-
101
-
102
-
103
-
104
-
105
-
106
-
107
-
108
-
109
-
110
-
111
-
112
-
113
-
114
-
115
-
116
-
117
-
118
-
119
-
120
-
121
-
122
-
123
-
124
-
125
-
126
-
127
-
128
-
129
-
130
-
131
-
132
-
133
-
134
-
135
-
136
-
137
-
138
-
139
-
 140
140 -
 141
141 -
 142
142 -
 143
143 -
 144
144 -
 145
145 -
 146
146 -
 147
147 -
 148
148 -
 149
149 -
 150
150 -
 151
151 -
 152
152 -
 153
153 -
 154
154 -
 155
155 -
 156
156
 |
 |

148
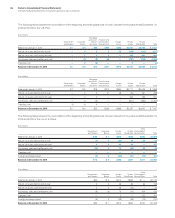
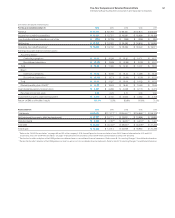
($ inmillions except per share amounts and stock prices)
2015 First Quarter Second Quarter Third Quarter Fourth Quarter Full Year
Revenue $19,590 $20,813 $19,280 $22,059 $81,741
Gross profi t $ 9,452 $10,390 $ 9,436 $11,407 $40,684
Income from continuing operations $ 2,415 $ 3,526 $ 2,962 $ 4,460 $13,364
Income/(loss) from discontinued operations, net of tax $ (88) $ (77) $ (12) $ 3 $ (174)
Net income $ 2,328 $ 3,449 $ 2,950 $ 4,463 $13,190
Operating (non-GAAP) earnings*** $ 2,890 $ 3,790 $ 3,272 $ 4,707 $14,659
Earnings per share of common stock*
Assuming dilution:
Continuing operations $ 2.44 $ 3.58 $ 3.02 $ 4.59 $ 13.60
Discontinued operations $ (0.09) $ (0.08) $ (0.01) $ 0.00 $ (0.18)
Total $ 2.35 $ 3.50 $ 3.01 $ 4.59 $ 13.42
Basic:
Continuing operations $ 2.45 $ 3.59 $ 3.04 $ 4.60 $ 13.66
Discontinued operations $ (0.09) $ (0.08) $ (0.01) $ 0.00 $ (0.18)
Total $ 2.36 $ 3.51 $ 3.03 $ 4.60 $ 13.48
Diluted operating (non-GAAP)*** $ 2.91 $ 3.84 $ 3.34 $ 4.84 $ 14.92
Dividends per share of common stock $ 1.10 $ 1.30 $ 1.30 $ 1.30 $ 5.00
Stock prices++
High $164.83 $174.40 $173.22 $152.39
Low $151.55 $159.18 $140.96 $131.75
($ inmillions except per share amounts and stock prices)
2014 First Quarter Second Quarter Third Quarter Fourth Quarter Full Year
Revenue $22,236 $24,047 $22,397 $24,113 $92,793
Gross profi t $10,627 $12,044 $10,874 $12,862 $46,407
Income from continuing operations $ 2,530 $ 4,251 $ 3,455 $ 5,515 $15,751
Loss from discontinued operations, net of tax $ (146) $ (115) $ (3,437) $ (31) $ (3,729)
Net income $ 2,384 $ 4,137 $ 18 $ 5,484 $12,022
Operating (non-GAAP) earnings*** $ 2,790 $ 4,456 $ 3,671 $ 5,785 $16,702
Earnings per share of common stock*
Assuming dilution:
Continuing operations $ 2.43 $ 4.23 $ 3.46 $ 5.54 $ 15.59
Discontinued operations $ (0.14) $ (0.11) $ (3.44) $ (0.03) $ (3.69)
Total $ 2.29 $ 4.12 $ 0.02 $ 5.51 $ 11.90
Basic:
Continuing operations $ 2.44 $ 4.25 $ 3.48 $ 5.57 $ 15.68
Discontinued operations $ (0.14) $ (0.11) $ (3.46) $ (0.03) $ (3.71)
Total $ 2.30 $ 4.14 $ 0.02 $ 5.54 $ 11.97
Diluted operating (non-GAAP)*** $ 2.68 $ 4.43 $ 3.68 $ 5.81 $ 16.53
Dividends per share of common stock $ 0.95 $ 1.10 $ 1.10 $ 1.10 $ 4.25
Stock prices++
High $195.63 $199.21 $196.40 $190.89
Low $172.19 $179.27 $181.70 $150.50
* Earnings Per Share (EPS) in each quarter is computed using the weighted-average number of shares outstanding during that quarter while EPS for the full year is computed
using the weighted-average number of shares outstanding during the year. Thus, the sum of the four quarters’ EPS does not equal the full-year EPS.
++ The stock prices reflect the high and low prices for IBM’s common stock on the New York Stock Exchange composite tape for the periods presented.
*** Refer to page70 of the company’s first-quarter 2015 Form 10-Q filed on April 28, 2015, page85 of the company’s second-quarter 2015 Form 10-Q filed on July 28, 2015,
page87 of the company’s third-quarter 2015 Form 10-Q filed on October 27, 2015, and page48 under the heading “GAAP Reconciliation,” for the reconciliation of non-GAAP
financial information for the quarterly periods of 2015 and 2014. Also see “GAAP Reconciliation,” on pages 41 and 42 for the reconciliation of non-GAAP financial information
for full-year 2015 and 2014.
Selected Quarterly Data
International Business Machines Corporation and Subsidiary Companies