IBM 2015 Annual Report Download - page 11
Download and view the complete annual report
Please find page 11 of the 2015 IBM annual report below. You can navigate through the pages in the report by either clicking on the pages listed below, or by using the keyword search tool below to find specific information within the annual report.-
 1
1 -
 2
2 -
 3
3 -
 4
4 -
 5
5 -
 6
6 -
 7
7 -
 8
8 -
 9
9 -
 10
10 -
 11
11 -
 12
12 -
 13
13 -
 14
14 -
 15
15 -
 16
16 -
 17
17 -
 18
18 -
 19
19 -
 20
20 -
 21
21 -
 22
22 -
23
-
24
-
25
-
26
-
27
-
28
-
29
-
30
-
31
-
32
-
33
-
34
-
35
-
36
-
37
-
38
-
39
-
40
-
41
-
42
-
43
-
44
-
45
-
46
-
47
-
48
-
49
-
50
-
51
-
52
-
53
-
54
-
55
-
56
-
57
-
58
-
59
-
60
-
61
-
62
-
63
-
64
-
65
-
66
-
67
-
68
-
69
-
70
-
71
-
72
-
73
-
74
-
75
-
76
-
77
-
78
-
79
-
80
-
81
-
82
-
83
-
84
-
85
-
86
-
87
-
88
-
89
-
90
-
91
-
92
-
93
-
94
-
95
-
96
-
97
-
98
-
99
-
100
-
101
-
102
-
103
-
104
-
105
-
106
-
107
-
108
-
109
-
110
-
111
-
112
-
113
-
114
-
115
-
116
-
117
-
118
-
119
-
120
-
121
-
122
-
123
-
124
-
125
-
126
-
127
-
128
-
129
-
130
-
131
-
132
-
133
-
134
-
135
-
136
-
137
-
138
-
139
-
140
-
141
-
142
-
143
-
144
-
145
-
146
-
147
-
148
-
149
-
150
-
151
-
152
-
153
-
154
-
155
-
156
 |
 |
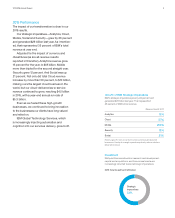
2015 IBM Annual Report 9
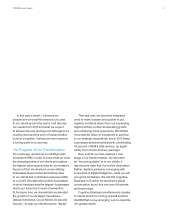
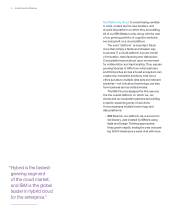
2015 Performance
The impact of our transformation is clear in our
2015 results.
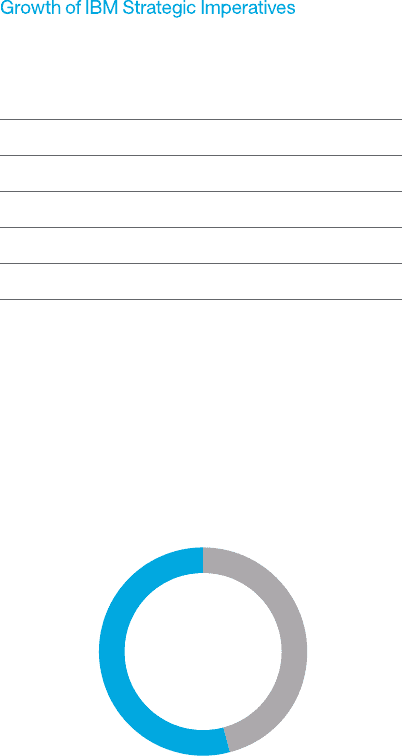
Our strategic imperatives—Analytics, Cloud,
Mobile, Social and Security—grew by 26percent
and generated $29billion last year. As I mention-
ed, that represented 35percent of IBM’s total
revenue at year end.
Adjusted for the impact of currency and
divestitures (as are all revenue results
reported in this letter), Analytics revenue grew
16percent for the year, to $18billion. Mobile
more than tripled for the second straight year.
Security grew 12percent. And Social was up
21percent. Not only did total Cloud revenue
increase by more than 50percent, to $10billion,
making ours the largest cloud business in the
world, but our cloud-delivered as-a-service
revenue continued to grow, reaching $4.5billion
in 2015, with a year-end annual run rate of
$5.3billion.
Even as we fueled these high-growth
businesses, we continued to bring innovation
to the businesses our clients have long valued
and relied on.
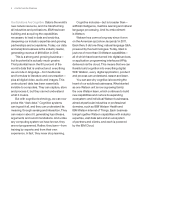
IBM Global Technology Services, which
is increasingly injecting automation and
cognition into our services delivery, grew both
IBM’
s strateg
i
c
i
mperat
i
ves grew
b
y 26 percent an
d
generate
d
$
29
billi
on
l
ast
y
ear.
Th
at represente
d
3
5 percent of IBM’s total revenue.
Revenue Growth Yr /Yr
Analytics 16%
Cloud 57%
Mobile 250%
Security 12%
Social 21%
Revenue growth rate is at constant currency and excludes divested
businesses. Overlap in strategic imperatives primarily refl ects solutions
delivered via Cloud.
Investment
IBM
pr
i
or
i
t
i
zes
i
nvestments
i
n researc
h
an
d
d
eve
l
op ment,
capital and acquisitions, and those investments are
increasingly directed toward strategic imperatives
.
2015 Total Investment:
$
13 billion
Strategic
Imperatives
54%