IBM 2015 Annual Report Download - page 103
Download and view the complete annual report
Please find page 103 of the 2015 IBM annual report below. You can navigate through the pages in the report by either clicking on the pages listed below, or by using the keyword search tool below to find specific information within the annual report.-
 1
1 -
2
-
3
-
4
-
5
-
6
-
7
-
8
-
9
-
10
-
11
-
12
-
13
-
14
-
15
-
16
-
17
-
18
-
19
-
20
-
21
-
22
-
23
-
24
-
25
-
26
-
27
-
28
-
29
-
30
-
31
-
32
-
33
-
34
-
35
-
36
-
37
-
38
-
39
-
40
-
41
-
42
-
43
-
44
-
45
-
46
-
47
-
48
-
49
-
50
-
51
-
52
-
53
-
54
-
55
-
56
-
57
-
58
-
59
-
60
-
61
-
62
-
63
-
64
-
65
-
66
-
67
-
68
-
69
-
70
-
71
-
72
-
73
-
74
-
75
-
76
-
77
-
78
-
79
-
80
-
81
-
82
-
83
-
84
-
85
-
86
-
87
-
88
-
89
-
90
-
91
-
92
-
 93
93 -
 94
94 -
 95
95 -
 96
96 -
 97
97 -
 98
98 -
 99
99 -
 100
100 -
 101
101 -
 102
102 -
 103
103 -
 104
104 -
 105
105 -
 106
106 -
 107
107 -
 108
108 -
 109
109 -
 110
110 -
 111
111 -
 112
112 -
 113
113 -
114
-
115
-
116
-
117
-
118
-
119
-
120
-
121
-
122
-
123
-
124
-
125
-
126
-
127
-
128
-
129
-
130
-
131
-
132
-
133
-
134
-
135
-
136
-
137
-
138
-
139
-
140
-
141
-
142
-
143
-
144
-
145
-
146
-
147
-
148
-
149
-
150
-
151
-
152
-
153
-
154
-
155
-
156
 |
 |

Notes to Consolidated Financial Statements
International Business Machines Corporation and Subsidiary Companies
101
market price is not available, an expected present value technique
that uses rates currently available to the company for debt with
similar terms and remaining maturities is used to estimate fair
value. The carrying amount of long-term debt is $33,428 million
and $34,991 million and the estimated fair value is $35,220 million
and $37,524 million at December31, 2015 and 2014, respectively. If
measured at fair value in the financial statements, long-term debt
(including the current portion) would be classified as Level2 in the
fair value hierarchy.
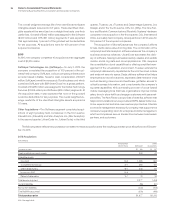
Debt and Marketable Equity Securities
The company’s cash equivalents and current debt securities are
considered available-for-sale and recorded at fair value, which is
not materially different from carrying value, in the Consolidated
Statement of Financial Position.
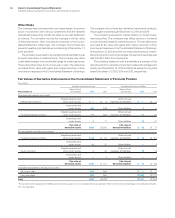
The following tables summarize the company’s noncurrent
debt and marketable equity securities which are also considered
available-for-sale and recorded at fair value in the Consolidated
Statement of Financial Position.
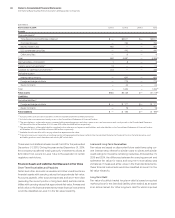
($ inmillions)
At December 31, 2015:
Adjusted
Cost
Gross
Unrealized
Gains
Gross
Unrealized
Losses
Fair
Value
Debt securities—noncurrent
(1) $ 5 $3 $ — $ 8
Available-for-sale equity investments
(1) $186 $6 $ 0 $192
(1) Included within investments and sundry assets in the Consolidated Statement of Financial Position.
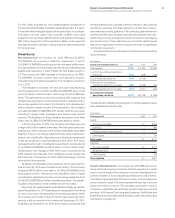
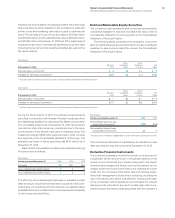
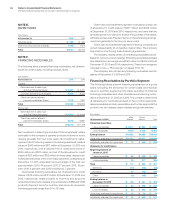
($ inmillions)
At December 31, 2014:
Adjusted
Cost
Gross
Unrealized
Gains
Gross
Unrealized
Losses
Fair
Value
Debt securities—noncurrent
(1) $ 7 $3 $ — $ 9
Available-for-sale equity investments
(1) $272 $2 $ 31 $243
(1) Included within investments and sundry assets in the Consolidated Statement of Financial Position.
During the fourth quarter of 2014, the company acquired equity
securities in conjunction with the sale of System x business which
are classified as available-for-sale securities. Based on an evalua-
tion of available evidence as of December31, 2015, the company
recorded an other-than-temporary impairment due to the dura-
tion and extent of the decline in fair value of these securities. The
impairment charge of $86million was recorded in other (income)
and expense in the Consolidated Statement of Earnings. The
adjusted cost basis of these securities was $185million as of
December31, 2015.
Sales of debt and available-for-sale equity investments during
the period were as follows:
($ inmillions)
For the year ended December 31: 2015 2014 2013
Proceeds $8 $21 $41
Gross realized gains (before taxes) 1013
Gross realized losses (before taxes) 155
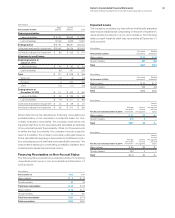
The after-tax net unrealized gains/(losses) on available-for-sale
debt and equity securities that have been included in other com-
prehensive income/(loss) and the after-tax net (gains)/losses
reclassified from accumulated other comprehensive income/(loss)
to net income were as follows:
($ inmillions)
For the year ended December 31: 2015 2014
Net unrealized gains/(losses)
arising during the period $(33) $(18)
Net unrealized (gains)/losses
reclassifi ed to net income* 53 3
* Includes pre-tax writedowns of $86million in 2015. There were no writedowns in 2014.
The contractual maturities of substantially all available-for-sale
debt securities are less than one year at December31, 2015.
Derivative Financial Instruments
The company operates in multiple functional currencies and is
a significant lender and borrower in the global markets. In the
normal course of business, the company is exposed to the impact
of interest rate changes and foreign currency fluctuations, and to
a lesser extent equity and commodity price changes and client
credit risk. The company limits these risks by following estab-
lished risk management policies and procedures, including the
use of derivatives, and, where cost effective, financing with debt
in the currencies in which assets are denominated. For interest
rate exposures, derivatives are used to better align rate move-
ments between the interest rates associated with the company’s