IBM 2015 Annual Report Download - page 31
Download and view the complete annual report
Please find page 31 of the 2015 IBM annual report below. You can navigate through the pages in the report by either clicking on the pages listed below, or by using the keyword search tool below to find specific information within the annual report.-
 1
1 -
2
-
3
-
4
-
5
-
6
-
7
-
8
-
9
-
10
-
11
-
12
-
13
-
14
-
15
-
16
-
17
-
18
-
19
-
20
-
 21
21 -
 22
22 -
 23
23 -
 24
24 -
 25
25 -
 26
26 -
 27
27 -
 28
28 -
 29
29 -
 30
30 -
 31
31 -
 32
32 -
 33
33 -
 34
34 -
 35
35 -
 36
36 -
 37
37 -
 38
38 -
 39
39 -
 40
40 -
 41
41 -
42
-
43
-
44
-
45
-
46
-
47
-
48
-
49
-
50
-
51
-
52
-
53
-
54
-
55
-
56
-
57
-
58
-
59
-
60
-
61
-
62
-
63
-
64
-
65
-
66
-
67
-
68
-
69
-
70
-
71
-
72
-
73
-
74
-
75
-
76
-
77
-
78
-
79
-
80
-
81
-
82
-
83
-
84
-
85
-
86
-
87
-
88
-
89
-
90
-
91
-
92
-
93
-
94
-
95
-
96
-
97
-
98
-
99
-
100
-
101
-
102
-
103
-
104
-
105
-
106
-
107
-
108
-
109
-
110
-
111
-
112
-
113
-
114
-
115
-
116
-
117
-
118
-
119
-
120
-
121
-
122
-
123
-
124
-
125
-
126
-
127
-
128
-
129
-
130
-
131
-
132
-
133
-
134
-
135
-
136
-
137
-
138
-
139
-
140
-
141
-
142
-
143
-
144
-
145
-
146
-
147
-
148
-
149
-
150
-
151
-
152
-
153
-
154
-
155
-
156
 |
 |

29
Management Discussion
International Business Machines Corporation and Subsidiary Companies
YEAR IN REVIEW
Results of Continuing Operations
Segment Details
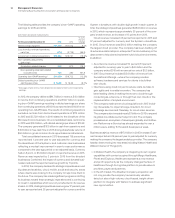
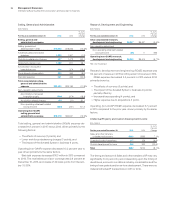
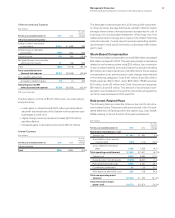
The following is an analysis of the 2015 versus 2014 reportable segment results. The table below presents each reportable segment’s
external revenue and gross margin results. Segment pre-tax income includes transactions between segments that are intended to reflect
an arm’s-length transfer price and excludes certain unallocated corporate items.
($ inmillions)
For the year ended December 31: 2015 2014**
Yr.-to-Yr.
Percent/
Margin
Change
Yr.-to-Yr.
Percent Change
Adjusted for
Currency
Revenue
Global Technology Services $32,017 $35,442 (9.7)% 0.5%*
Gross margin 37.4% 39.0% (1.5) pts.
Global Business Services 17,166 19,512 (12.0)% (4.1)%*
Gross margin 28.2% 30.4% (2.2) pts.
Software 22,932 25,434 (9.8)% (3.5)%
Gross margin 87.3% 88.6% (1.3) pts.
Systems Hardware 7,581 9,996 (24.2)% 7.6%*
Gross margin 46.6% 39.5% 7.2 pts.
Global Financing 1,840 2,034 (9.5)% 1.5%
Gross margin 45.6% 49.4% (3.7) pts.
Other 206 374 (45.0)% (39.1)%
Gross margin (253.0)% (215.0)% (38.0) pts.
Total consolidated revenue $81,741 $92,793 (11.9)% (1.2)%*
Total consolidated gross profi t $40,684 $46,407 (12.3)%
Total consolidated gross margin 49.8% 50.0% (0.2) pts.
Non-operating adjustments
Amortization of acquired intangible assets 373 416 (10.5)%
Retirement-related costs/(income) 469 173 170.7%
Operating (non-GAAP) gross profi t $41,526 $46,996 (11.6)%
Operating (non-GAAP) gross margin 50.8% 50.6% 0.2 pts.
* Adjusted for divestitures and currency.
** Reclassified to conform with 2015 presentation.
Global Services
In 2015, the Global Services segments, GTS and GBS, delivered
combined revenue of $49,182 million, a decrease of 10.5percent as
reported and 1percent adjusted for currency (9points) and dives-
titures. Total outsourcing revenue of $21,889 million decreased
10.7percent as reported and 1percent adjusted for currency
(10points) and divestitures. Total transactional revenue of $21,161
million decreased 10.3percent and 2percent adjusted for cur-
rency. The estimated Global Services backlog at December31,
2015 of $121billion increased 1percent year to year, adjusted
for currency. Combined pre-tax income for the year decreased
18.2percent and the pre-tax margin decreased 1.4points to
15.1percent.