IBM 2015 Annual Report Download - page 149
Download and view the complete annual report
Please find page 149 of the 2015 IBM annual report below. You can navigate through the pages in the report by either clicking on the pages listed below, or by using the keyword search tool below to find specific information within the annual report.-
 1
1 -
2
-
3
-
4
-
5
-
6
-
7
-
8
-
9
-
10
-
11
-
12
-
13
-
14
-
15
-
16
-
17
-
18
-
19
-
20
-
21
-
22
-
23
-
24
-
25
-
26
-
27
-
28
-
29
-
30
-
31
-
32
-
33
-
34
-
35
-
36
-
37
-
38
-
39
-
40
-
41
-
42
-
43
-
44
-
45
-
46
-
47
-
48
-
49
-
50
-
51
-
52
-
53
-
54
-
55
-
56
-
57
-
58
-
59
-
60
-
61
-
62
-
63
-
64
-
65
-
66
-
67
-
68
-
69
-
70
-
71
-
72
-
73
-
74
-
75
-
76
-
77
-
78
-
79
-
80
-
81
-
82
-
83
-
84
-
85
-
86
-
87
-
88
-
89
-
90
-
91
-
92
-
93
-
94
-
95
-
96
-
97
-
98
-
99
-
100
-
101
-
102
-
103
-
104
-
105
-
106
-
107
-
108
-
109
-
110
-
111
-
112
-
113
-
114
-
115
-
116
-
117
-
118
-
119
-
120
-
121
-
122
-
123
-
124
-
125
-
126
-
127
-
128
-
129
-
130
-
131
-
132
-
133
-
134
-
135
-
136
-
137
-
138
-
 139
139 -
 140
140 -
 141
141 -
 142
142 -
 143
143 -
 144
144 -
 145
145 -
 146
146 -
 147
147 -
 148
148 -
 149
149 -
 150
150 -
 151
151 -
 152
152 -
 153
153 -
 154
154 -
 155
155 -
 156
156
 |
 |

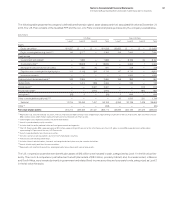
147
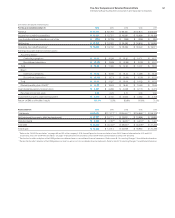
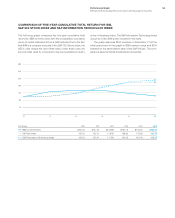
Five-Year Comparison of Selected Financial Data
International Business Machines Corporation and Subsidiary Companies
($ inmillions except per share amounts)
For the year ended December 31: 2015 2014 2013 2012 2011
Revenue $ 81,741 $ 92,793 $ 98,367 $102,874 $105,056
Income from continuing operations $ 13,364 $ 15,751 $ 16,881 $ 16,999 $ 16,108
Loss from discontinued operations, net of tax $ (174) $ (3,729) $ (398) $ (395) $ (253)
Net income $ 13,190 $ 12,022 $ 16,483 $ 16,604 $ 15,855
Operating (non-GAAP) earnings* $ 14,659 $ 16,702 $ 18,356 $ 18,022 $ 16,571
Earnings/(loss) per share of common stock:
Assuming dilution:
Continuing operations $ 13.60 $ 15.59 $ 15.30 $ 14.71 $ 13.27
Discontinued operations $ (0.18) $ (3.69) $ (0.36) $ (0.34) $ (0.21)
Total $ 13.42 $ 11.90 $ 14.94 $ 14.37 $ 13.06
Basic:
Continuing operations $ 13.66 $ 15.68 $ 15.42 $ 14.88 $ 13.46
Discontinued operations $ (0.18) $ (3.71) $ (0.36) $ (0.35) $ (0.21)
Total $ 13.48 $ 11.97 $ 15.06 $ 14.53 $ 13.25
Diluted operating (non-GAAP)* $ 14.92 $ 16.53 $ 16.64 $ 15.60 $ 13.65
Cash dividends paid on common stock $ 4,897 $ 4,265 $ 4,058 $ 3,773 $ 3,473
Per share of common stock 5.00 4.25 3.70 3.30 2.90
Investment in property, plant and equipment $ 3,579 $ 3,740 $ 3,623 $ 4,082 $ 4,108
Return on IBM stockholders’ equity 101.1% 72.5% 83.8% 81.6% 71.2%
At December 31: 2015 2014 2013 2012 2011
Total as sets $110,495 $117,271 ** +$125,641 ** +$118,965 ** +$116,128 ** +
Net investment in property, plant and equipment $ 10,727 $ 10,771 $ 13,821 $ 13,996 $ 13,883
Working capital $ 8,235 $ 7,797** $ 9,610** $ 4,413** $ 7,347**
Total de bt $ 39,890 $ 40,722+$ 39,637+$ 33,209+$ 31,265+
Total eq uit y $ 14,424 $ 12,014 $ 22,929 $ 18,984 $ 20,236
* Refer to the “GAAP Reconciliation,” on pages 63 and 151 of the company’s 2014 Annual Report for the reconciliation of non-GAAP financial information for 2012 and 2011,
respectively. Also see “GAAP Reconciliation,” on pages 41 and 59 for the reconciliation of non-GAAP financial information for 2015, 2014 and 2013.
** Reclassified to reflect adoption of the FASB guidance on deferred taxes in consolidated financial statements. Refer to noteB, “Accounting Changes,” for additional information.
+ Reclassified to reflect adoption of the FASB guidance on debt issuance costs in consolidated financial statements. Refer to noteB, “Accounting Changes,” for additional information.