IBM 2015 Annual Report Download - page 39
Download and view the complete annual report
Please find page 39 of the 2015 IBM annual report below. You can navigate through the pages in the report by either clicking on the pages listed below, or by using the keyword search tool below to find specific information within the annual report.-
 1
1 -
2
-
3
-
4
-
5
-
6
-
7
-
8
-
9
-
10
-
11
-
12
-
13
-
14
-
15
-
16
-
17
-
18
-
19
-
20
-
21
-
22
-
23
-
24
-
25
-
26
-
27
-
28
-
 29
29 -
 30
30 -
 31
31 -
 32
32 -
 33
33 -
 34
34 -
 35
35 -
 36
36 -
 37
37 -
 38
38 -
 39
39 -
 40
40 -
 41
41 -
 42
42 -
 43
43 -
 44
44 -
 45
45 -
 46
46 -
 47
47 -
 48
48 -
 49
49 -
50
-
51
-
52
-
53
-
54
-
55
-
56
-
57
-
58
-
59
-
60
-
61
-
62
-
63
-
64
-
65
-
66
-
67
-
68
-
69
-
70
-
71
-
72
-
73
-
74
-
75
-
76
-
77
-
78
-
79
-
80
-
81
-
82
-
83
-
84
-
85
-
86
-
87
-
88
-
89
-
90
-
91
-
92
-
93
-
94
-
95
-
96
-
97
-
98
-
99
-
100
-
101
-
102
-
103
-
104
-
105
-
106
-
107
-
108
-
109
-
110
-
111
-
112
-
113
-
114
-
115
-
116
-
117
-
118
-
119
-
120
-
121
-
122
-
123
-
124
-
125
-
126
-
127
-
128
-
129
-
130
-
131
-
132
-
133
-
134
-
135
-
136
-
137
-
138
-
139
-
140
-
141
-
142
-
143
-
144
-
145
-
146
-
147
-
148
-
149
-
150
-
151
-
152
-
153
-
154
-
155
-
156
 |
 |

37
Management Discussion
International Business Machines Corporation and Subsidiary Companies
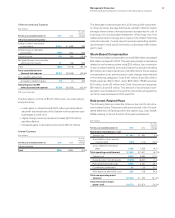
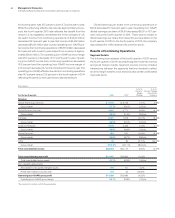
Other (Income) and Expense
($ inmillions)
For the year ended December 31: 2015 2014
Yr.-to-Yr.
Percent
Change
Other (income) and expense
Foreign currency transaction
losses/(gains) $ 414 $ (599) NM
(Gains)/losses on derivative
instruments (853) 654 NM
Interest income (72) (90) (19.8)%
Net (gains)/losses from securities
and investment assets 47 (26) NM
Other (260) (1,878) (86.1)%
Total consolidated other
(income) and expense $(724) $(1,938) (62.6)%
Non-operating adjustment
Acquisition-related charges (5) (1) NM
Operating (non-GAAP)
other (income) and expense $(729) $(1,939) (62.4)%
NM—Not meaningful
The decrease in income of $1,214 million year over year was pri-
marily driven by:
• Lower gains on divestitures ($1,623 million) primarily associ-
ated with the divestitures of the Systemx and customer care
businesses in 2014; and
• Higher foreign currency transaction losses ($1,013 million);
partially offset by
• Increased gains on derivative instruments ($1,507 million).
Interest Expense
($ inmillions)
For the year ended December 31: 2015 2014
Yr.-to-Yr.
Percent
Change
Interest expense
Total $468 $484 (3.2)%
The decrease in interest expense in 2015 versus 2014 was primar-
ily driven by lower average debt levels, partially offset by higher
average interest rates. Interest expense is presented in cost of
financing in the Consolidated Statement of Earnings only if the
related external borrowings are to support the Global Financing
external business. Overall interest expense (excluding capital-
ized interest) in 2015 was $1,009 million, a decrease of $16million
year to year.
Stock-Based Compensation
Pre-tax stock-based compensation cost of $468million decreased
$44million compared to 2014. This was due primarily to decreases
related to performance share units ($32million), the conversion
of stock-based awards previously issued by acquired entities
($6million) and restricted stock units ($6million). Stock-based
compensation cost, and the year-to-year change, was reflected
in the following categories: Cost: $100million, down $21million;
SG&A expense: $322million, down $28million; RD&E expense:
$51million, down $3million and Other (income) and expense:
($6million), down $8million. The amount of stock-based com-
pensation cost included in the loss from discontinued operations,
net of tax, was immaterial in 2015 and 2014.
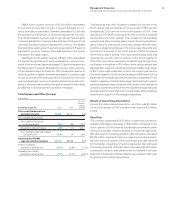
Retirement-Related Plans
The following table provides the total pre-tax cost for all retire -
ment-related plans. These amounts are included in the Consoli-
dated Statement of Earnings within the caption (e.g., Cost, SG&A,
RD&E) relating to the job function of the plan participants.
($ inmillions)
For the year ended December 31: 2015 2014
Yr.-to-Yr.
Percent
Change
Retirement-related plans—cost
Service cost $ 484 $ 482 0.5%
Amortization of prior service
costs/(credits) (100) (114) (12.0)
Cost of defi ned contribution
plans 1,138 1,253 (9.2)
Total operating costs/(income) $ 1,522 $ 1,621 (6.1)%
Interest cost 3,316 3,994 (17.0)
Expected return on plan assets (5,879) (6,351) (7.4)
Recognized actuarial losses 3,283 2,467 33.1
Curtailments/settlements 36 25 41.2
Multi-employer plan/other costs 293 218 34.8
Total non-operating costs/
(income) $ 1,050 $ 353 197.2%
Total retirement-related
plans—cost $ 2,572 $ 1,974 30.3%