IBM 2015 Annual Report Download - page 58
Download and view the complete annual report
Please find page 58 of the 2015 IBM annual report below. You can navigate through the pages in the report by either clicking on the pages listed below, or by using the keyword search tool below to find specific information within the annual report.-
 1
1 -
2
-
3
-
4
-
5
-
6
-
7
-
8
-
9
-
10
-
11
-
12
-
13
-
14
-
15
-
16
-
17
-
18
-
19
-
20
-
21
-
22
-
23
-
24
-
25
-
26
-
27
-
28
-
29
-
30
-
31
-
32
-
33
-
34
-
35
-
36
-
37
-
38
-
39
-
40
-
41
-
42
-
43
-
44
-
45
-
46
-
47
-
 48
48 -
 49
49 -
 50
50 -
 51
51 -
 52
52 -
 53
53 -
 54
54 -
 55
55 -
 56
56 -
 57
57 -
 58
58 -
 59
59 -
 60
60 -
 61
61 -
 62
62 -
 63
63 -
 64
64 -
 65
65 -
 66
66 -
 67
67 -
 68
68 -
69
-
70
-
71
-
72
-
73
-
74
-
75
-
76
-
77
-
78
-
79
-
80
-
81
-
82
-
83
-
84
-
85
-
86
-
87
-
88
-
89
-
90
-
91
-
92
-
93
-
94
-
95
-
96
-
97
-
98
-
99
-
100
-
101
-
102
-
103
-
104
-
105
-
106
-
107
-
108
-
109
-
110
-
111
-
112
-
113
-
114
-
115
-
116
-
117
-
118
-
119
-
120
-
121
-
122
-
123
-
124
-
125
-
126
-
127
-
128
-
129
-
130
-
131
-
132
-
133
-
134
-
135
-
136
-
137
-
138
-
139
-
140
-
141
-
142
-
143
-
144
-
145
-
146
-
147
-
148
-
149
-
150
-
151
-
152
-
153
-
154
-
155
-
156
 |
 |

56 Management Discussion
International Business Machines Corporation and Subsidiary Companies
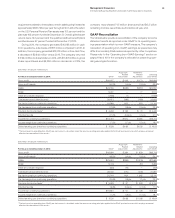
The company announced the divestiture of its Microelectronics
business with future chip supply coming from an at-scale provider,
and has committed $3billion of investment over five years in the
next era of chip technology as it strengthens its semiconductor
research and development and systems innovation. The company
also divested the Systemx business, and announced the z13, the
new generation of the mainframe. With its portfolio repositioned
and the introduction of the new mainframe, this business segment
should now see profit leverage going forward.
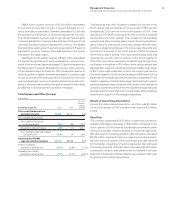
Global Financing
See pages 69 through 73 for an analysis of Global Financing’s
segment results.
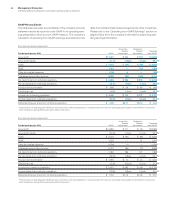
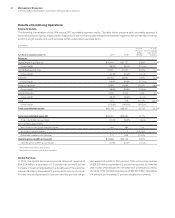
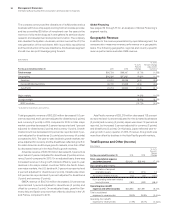
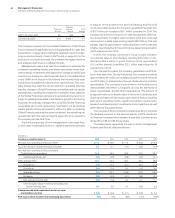
Geographic Revenue
In addition to the revenue presentation by reportable segment, the
company also measures revenue performance on a geographic
basis. The following geographic, regional and country-specific
revenue performance excludes OEM revenue.
($ inmillions)
For the year ended December 31: 2014 2013
Yr.-to-Yr.
Percent
Change
Yr.-to-Yr.
Percent Change
Adjusted for
Currency*
Total revenue $92,793 $98,367 (5.7)% (1.5)%
Geographies $92,326 $97,800 (5.6)% (1.5)%
Americas 41,410 43,249 (4.3) (0.8)
Europe/Middle East/Africa 30,700 31,628 (2.9) (0.6)
Asia Pacifi c 20,216 22,923 (11.8) (4.1)
Major markets (4.3)% (1.0)%
Growth markets (9.9)% (3.2)%
BRIC countries (10.7)% (4.5)%
* Adjusted for divestitures and currency.
Total geographic revenue of $92,326 million decreased 5.6per-
cent as reported and 1percent adjusted for divestitures (2points)
and currency (2points) in 2014 compared to 2013. In total, major
market countries decreased 4.3percent as reported and 1percent
adjusted for divestitures (2points) and currency (1point). Growth
market countries decreased 9.9percent as reported and 3per-
cent adjusted for divestitures (3points) and currency (4points)
compared to 2013. The year-to-year decline in growth markets rev-
enue adjusted for currency and the divestitures reflected growth in
the Latin American and Europe growth markets, more than offset
by decreased revenue in the Asia Pacific growth markets.
Americas revenue of $41,410 million decreased 4.3percent as
reported and 1percent adjusted for divestitures (2points) and cur-
rency (1point) compared to 2013. On an adjusted basis, there was
increased revenue in the growth markets offset by year-to-year
declines in the major market countries. Within the North Ameri-
can major markets, the U.S. declined 4.0percent as reported and
2percent adjusted for divestitures (2points). Canada was down
9.8percent as reported and 2percent adjusted for divestitures
(1point) and currency (7points).
EMEA revenue of $30,700 million decreased 2.9percent as
reported and 1percent adjusted for divestitures (3points) and
offset by currency (1point). On an adjusted basis, growth in Ger-
many, Italy and Spain was more than offset by declines in the UK
and France, compared to 2013.
Asia Pacific revenue of $20,216 million decreased 11.8percent
as reported and 4percent adjusted for the divested businesses
(3points) and currency (5points). Japan was down 7.6percent as
reported, but increased 3percent adjusted for currency (8points)
and divestitures (3points). On this basis, Japan reflected year-to-
year growth in every quarter of 2014. However, this growth was
more than offset by declines in the Asia Pacific growth markets.
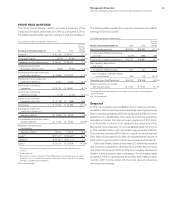
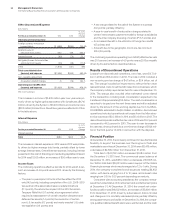
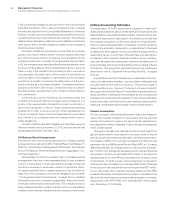
Total Expense and Other (Income)
($ inmillions)
For the year ended December 31: 2014 2013
Yr.-to-Yr.
Percent/
Margin
Change
Total consolidated expense
and other (income) $26,421 $28,440 (7.1)%
Non-operating adjustments
Amortization of acquired
intangible assets (374) (370) 1.2
Acquisition-related charges (12) (40) (70.0)
Non-operating retirement-related
(costs)/income (180) (433) (58.4)
Operating (non-GAAP)
expense and other (income) $25,855 $27,597 (6.3)%
Total co nso lid ated
expense-to-revenue ratio 28.5% 28.9% (0.4) pts.
Operating (non-GAAP)
expense-to-revenue ratio 27.9% 28.1% (0.2) pts.