IBM 2015 Annual Report Download - page 33
Download and view the complete annual report
Please find page 33 of the 2015 IBM annual report below. You can navigate through the pages in the report by either clicking on the pages listed below, or by using the keyword search tool below to find specific information within the annual report.-
 1
1 -
2
-
3
-
4
-
5
-
6
-
7
-
8
-
9
-
10
-
11
-
12
-
13
-
14
-
15
-
16
-
17
-
18
-
19
-
20
-
21
-
22
-
 23
23 -
 24
24 -
 25
25 -
 26
26 -
 27
27 -
 28
28 -
 29
29 -
 30
30 -
 31
31 -
 32
32 -
 33
33 -
 34
34 -
 35
35 -
 36
36 -
 37
37 -
 38
38 -
 39
39 -
 40
40 -
 41
41 -
 42
42 -
 43
43 -
44
-
45
-
46
-
47
-
48
-
49
-
50
-
51
-
52
-
53
-
54
-
55
-
56
-
57
-
58
-
59
-
60
-
61
-
62
-
63
-
64
-
65
-
66
-
67
-
68
-
69
-
70
-
71
-
72
-
73
-
74
-
75
-
76
-
77
-
78
-
79
-
80
-
81
-
82
-
83
-
84
-
85
-
86
-
87
-
88
-
89
-
90
-
91
-
92
-
93
-
94
-
95
-
96
-
97
-
98
-
99
-
100
-
101
-
102
-
103
-
104
-
105
-
106
-
107
-
108
-
109
-
110
-
111
-
112
-
113
-
114
-
115
-
116
-
117
-
118
-
119
-
120
-
121
-
122
-
123
-
124
-
125
-
126
-
127
-
128
-
129
-
130
-
131
-
132
-
133
-
134
-
135
-
136
-
137
-
138
-
139
-
140
-
141
-
142
-
143
-
144
-
145
-
146
-
147
-
148
-
149
-
150
-
151
-
152
-
153
-
154
-
155
-
156
 |
 |

31
Management Discussion
International Business Machines Corporation and Subsidiary Companies
($ inmillions)
For the year ended December 31: 2015 2014*
Yr.-to-Yr.
Percent/
Margin
Change
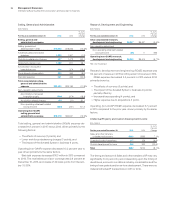
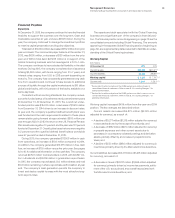
Global Services
Global Technology Services
External gross profi t $11,981 $13,808 (13.2)%
External gross profi t margin 37.4% 39.0% (1.5) pts.
Pre-tax income $ 5,002 $ 5,931 (15.7)%
Pre-tax margin 15.2% 16.3% (1.1) pts.
Global Business Services
External gross profi t $ 4,837 $ 5,923 (18.3)%
External gross profi t margin 28.2% 30.4% (2.2) pts.
Pre-tax income $ 2,634 $ 3,408 (22.7)%
Pre-tax margin 14.9% 17.0% (2.1) pts.
* Reclassified to conform with 2015 presentation.
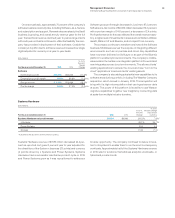
The GTS gross profit margin decreased 1.5points to 37.4per-
cent in 2015 compared to prior year. Pre-tax income decreased
15.7percent to $5,002 million. The GTS pre-tax margin declined
1.1points to 15.2percent compared to the prior year, primarily due
to investments being made in this business. The company con-
tinues to invest to deliver the most contemporary offerings that
are built with cloud, analytics, mobile, security and cognitive tech-
nologies enabling it to transform clients’ enterprises. In addition,
currency had a large year-to-year impact on profit given the strong
dollar currency environment.
The GBS gross profit margin decreased 2.2points to 28.2per-
cent in 2015 compared to the prior year. Pre-tax income decreased
22.7percent to $2,634 million and pre-tax margin declined
2.1points to 14.9percent compared to the prior year. This year-to-
year profit decline reflects the market shifts in the GBS business.
In parts of the portfolio where the market is declining, there is
price and profit pressure and action is being taken to optimize the
cost structure in these areas. The company continues to shift and
add significant resources to the high-growth analytics, cloud and
mobility practices, which impacts productivity and margin in the
near term.
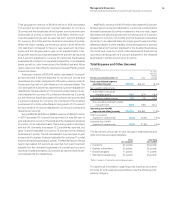
Global Services Backlog
The estimated Global Services backlog at December31, 2015 was
$121billion, a decrease of 6.0percent as reported, but an increase
of 1percent adjusted for currency, compared to the December31,
2014 balance. The estimated transactional backlog at Decem-
ber31, 2015 decreased 6.5percent as reported, but was flat year
to year adjusted for currency. The estimated outsourcing backlog
decreased 5.4percent as reported, but grew 2percent adjusted
for currency compared to the prior year.
Clients are looking to transform their most critical systems into
hybrid cloud environments, and the complexity of these partner-
ships in many cases results in larger engagements. For the full year
of 2015, over 70 services deals greater than $100million were
signed, which was 40percent more than in 2014. About 70percent
of those transactions feature hybrid cloud content, which reflects
both the value IBM’s clients see in hybrid and the reality that not
all their workloads are optimized for the cloud.
($ inbillions)
At December 31: 2015 2014
Yr.-to-Yr.
Percent
Change
Yr.-to-Yr.
Percent Change
Adjusted for
Currency
Backlog
Total backl og $120.7 $128.4 (6.0)% 0.8%
Outsourcing backlog 76.4 80.8 (5.4) 1.7
Total Global Services backlog includes GTS Outsourcing, ITS,
GBS Outsourcing, Consulting and Systems Integration and Main-
tenance. Outsourcing backlog includes GTS Outsourcing and GBS
Outsourcing. Transactional backlog includes ITS and Consulting
and Systems Integration. Total backlog is intended to be a state-
ment of overall work under contract and therefore does include
Maintenance. Backlog estimates are subject to change and are
affected by several factors, including terminations, changes in the
scope of contracts, periodic revalidations, adjustments for revenue
not materialized and adjustments for currency.
Global Services signings are management’s initial estimate
of the value of a client’s commitment under a Global Services
contract. There are no third-party standards or requirements
governing the calculation of signings. The calculation used by
management involves estimates and judgments to gauge the
extent of a client’s commitment, including the type and duration of
the agreement, and the presence of termination charges or wind-
down costs.