IBM 2015 Annual Report Download - page 141
Download and view the complete annual report
Please find page 141 of the 2015 IBM annual report below. You can navigate through the pages in the report by either clicking on the pages listed below, or by using the keyword search tool below to find specific information within the annual report.-
 1
1 -
2
-
3
-
4
-
5
-
6
-
7
-
8
-
9
-
10
-
11
-
12
-
13
-
14
-
15
-
16
-
17
-
18
-
19
-
20
-
21
-
22
-
23
-
24
-
25
-
26
-
27
-
28
-
29
-
30
-
31
-
32
-
33
-
34
-
35
-
36
-
37
-
38
-
39
-
40
-
41
-
42
-
43
-
44
-
45
-
46
-
47
-
48
-
49
-
50
-
51
-
52
-
53
-
54
-
55
-
56
-
57
-
58
-
59
-
60
-
61
-
62
-
63
-
64
-
65
-
66
-
67
-
68
-
69
-
70
-
71
-
72
-
73
-
74
-
75
-
76
-
77
-
78
-
79
-
80
-
81
-
82
-
83
-
84
-
85
-
86
-
87
-
88
-
89
-
90
-
91
-
92
-
93
-
94
-
95
-
96
-
97
-
98
-
99
-
100
-
101
-
102
-
103
-
104
-
105
-
106
-
107
-
108
-
109
-
110
-
111
-
112
-
113
-
114
-
115
-
116
-
117
-
118
-
119
-
120
-
121
-
122
-
123
-
124
-
125
-
126
-
127
-
128
-
129
-
130
-
 131
131 -
 132
132 -
 133
133 -
 134
134 -
 135
135 -
 136
136 -
 137
137 -
 138
138 -
 139
139 -
 140
140 -
 141
141 -
 142
142 -
 143
143 -
 144
144 -
 145
145 -
 146
146 -
 147
147 -
 148
148 -
 149
149 -
 150
150 -
 151
151 -
152
-
153
-
154
-
155
-
156
 |
 |
Notes to Consolidated Financial Statements
International Business Machines Corporation and Subsidiary Companies
139
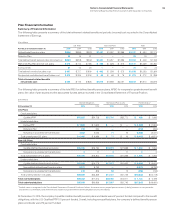
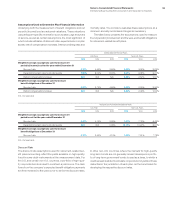
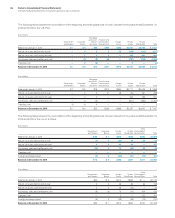
Valuation Techniques
The following is a description of the valuation techniques used
to measure plan assets at fair value. There were no changes in
valuation techniques during 2015 and 2014.
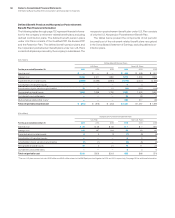
Equity securities are valued at the closing price reported on
the stock exchange on which the individual securities are traded.
IBM common stock is valued at the closing price reported on the
New York Stock Exchange. Equity commingled/mutual funds are
typically valued using the net asset value (NAV) provided by the
administrator of the fund and reviewed by the company. The NAV
is based on the value of the underlying assets owned by the fund,
minus liabilities and divided by the number of shares or units out-
standing. These assets are classified as Level1, Level2 or Level3
depending on availability of quoted market prices.
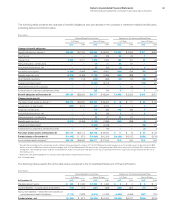
The fair value of fixed-income securities is typically estimated
using pricing models, quoted prices of securities with similar char-
acteristics or discounted cash flows and are generally classified
as Level2. If available, they are valued using the closing price
reported on the major market on which the individual securities
are traded.
Cash includes money market accounts that are valued at their
cost plus interest on a daily basis, which approximates fair value.
Short-term investments represent securities with original matur-
ities of one year or less. These assets are classified as Level1 or
Level2.
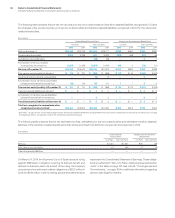
Private equity and private real estate partnership valuations
require significant judgment due to the absence of quoted market
prices, the inherent lack of liquidity and the long-term nature of
such assets. These assets are initially valued at cost and are
reviewed periodically utilizing available and relevant market data to
determine if the carrying value of these assets should be adjusted.
These investments are classified as Level3. The valuation meth-
odology is applied consistently from period to period.
Exchange traded derivatives are valued at the closing price
reported on the exchange on which the individual securities are
traded, while forward contracts are valued using a mid-close
price. Over-the-counter derivatives are typically valued using
pricing models. The models require a variety of inputs, including,
for example, yield curves, credit curves, measures of volatility and
foreign exchange rates. These assets are classified as Level1 or
Level2 depending on availability of quoted market prices.
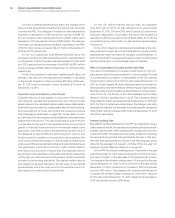
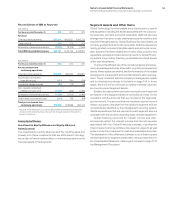
Expected Contributions
Defined Benefit Pension Plans
It is the company’s general practice to fund amounts for pensions
sufficient to meet the minimum requirements set forth in applicable
employee benefits laws and local tax laws. From time to time, the
company contributes additional amounts as it deems appropriate.
The company contributed $474million in cash to non-U.S.
defined benefit pension plans and $40million in cash to multi-em-
ployer plans for the year ended December31, 2015. For the year
ended December31, 2014, the company contributed $465million
in cash to non-U.S. defined benefit pension plans and $54mil-
lion in cash to multi-employer plans. The cash contributions to
multi-employer plans represent the annual cost included in net
periodic (income)/cost recognized in the Consolidated Statement
of Earnings. The company’s participation in multi-employer plans
has no material impact on the company’s financial statements.
In 2016, the company is not legally required to make any con-
tributions to the U.S. defined benefit pension plans. However,
depending on market conditions, or other factors, the company
may elect to make discretionary contributions to the Qualified PPP
during the year.
The Pension Protection Act of 2006 (the Act), enacted into law
in 2006, is a comprehensive reform package that, among other
provisions, increases pension funding requirements for certain U.S.
defined benefit plans, provides guidelines for measuring pension
plan assets and pension obligations for funding purposes and
raises tax deduction limits for contributions to retirement-related
benefit plans. The additional funding requirements by the Act apply
to plan years beginning after December31, 2007. The Act was
updated by the Worker, Retiree and Employer Recovery Act of
2008, which revised the funding requirements in the Act by clar-
ifying that pension plans may smooth the value of pension plans
over 24 months. At December31, 2015, no mandatory contribution
was required for 2016.
In 2016, the company estimates contributions to its non-U.S.
defined benefit and multi-employer plans to be approximately
$500million, the largest of which will be contributed to defined
benefit pension plans in the UK, Japan and Spain. This amount
represents the legally mandated minimum contributions. Financial
market performance in 2016 could increase the legally mandated
minimum contribution in certain countries which require monthly
or daily remeasurement of the funded status. The company could
also elect to contribute more than the legally mandated amount
based on market conditions or other factors.