IBM 2015 Annual Report Download - page 42
Download and view the complete annual report
Please find page 42 of the 2015 IBM annual report below. You can navigate through the pages in the report by either clicking on the pages listed below, or by using the keyword search tool below to find specific information within the annual report.-
 1
1 -
2
-
3
-
4
-
5
-
6
-
7
-
8
-
9
-
10
-
11
-
12
-
13
-
14
-
15
-
16
-
17
-
18
-
19
-
20
-
21
-
22
-
23
-
24
-
25
-
26
-
27
-
28
-
29
-
30
-
31
-
 32
32 -
 33
33 -
 34
34 -
 35
35 -
 36
36 -
 37
37 -
 38
38 -
 39
39 -
 40
40 -
 41
41 -
 42
42 -
 43
43 -
 44
44 -
 45
45 -
 46
46 -
 47
47 -
 48
48 -
 49
49 -
 50
50 -
 51
51 -
 52
52 -
53
-
54
-
55
-
56
-
57
-
58
-
59
-
60
-
61
-
62
-
63
-
64
-
65
-
66
-
67
-
68
-
69
-
70
-
71
-
72
-
73
-
74
-
75
-
76
-
77
-
78
-
79
-
80
-
81
-
82
-
83
-
84
-
85
-
86
-
87
-
88
-
89
-
90
-
91
-
92
-
93
-
94
-
95
-
96
-
97
-
98
-
99
-
100
-
101
-
102
-
103
-
104
-
105
-
106
-
107
-
108
-
109
-
110
-
111
-
112
-
113
-
114
-
115
-
116
-
117
-
118
-
119
-
120
-
121
-
122
-
123
-
124
-
125
-
126
-
127
-
128
-
129
-
130
-
131
-
132
-
133
-
134
-
135
-
136
-
137
-
138
-
139
-
140
-
141
-
142
-
143
-
144
-
145
-
146
-
147
-
148
-
149
-
150
-
151
-
152
-
153
-
154
-
155
-
156
 |
 |

40 Management Discussion
International Business Machines Corporation and Subsidiary Companies
• A decrease in other accrued expenses and liabilities of $1,641
million ($1,281 million adjusted for currency) driven by net
activity associated with the Microelectronics divestiture and
workforce rebalancing payments; and
• A decrease in deferred income of $856million ($226million
adjusted for currency); and a decline of $837million ($568
million adjusted for currency) in accounts payable reflecting
the wind down of the divested Systemx business payables
and decreases in counterparty collateral postings; partially
offset by
• An increase in short-term debt of $731million ($872million
adjusted for currency).
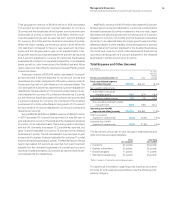
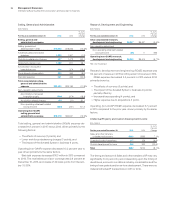
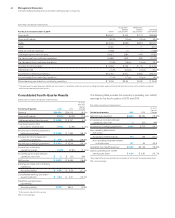
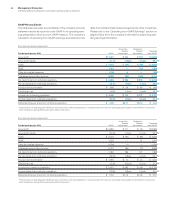
Cash Flow
The company’s cash flows from operating, investing and financ-
ing activities, as reflected in the Consolidated Statement of Cash
Flows on page79 are summarized in the table below. These
amounts include the cash flows associated with the Global Financ-
ing business.
($ inmillions)
For the year ended December 31: 2015 2014
Net cash provided by/(used in)
continuing operations
Operating activities $17,008 $ 16,868
Investing activities (8,159) (3,001)
Financing activities (9,166) (15,452)
Effect of exchange rate changes on
cash and cash equivalents (473) (655)
Net change in cash and cash equivalents $ (790) $ (2,240)
Net cash provided by operating activities increased by $139million
in 2015 driven by the following key factors:
• A decline in cash income tax payments ($3,092 million); and
• An improvement in sales cycle working capital of $1,192million;
partially offset by
• Performance-related declines within net income; and
• An increase in performance-related compensation payments
of $470million.
Net cash used in investing activities increased $5,158 million
driven by:
• A decrease in cash provided by divestitures of $2,758
million; and
• An increase in cash used related to acquisitions of
$2,693 million.
Net cash used in financing activities decreased $6,286 million as
compared to the prior year driven by the following factors:
• A decrease of $9,070 million of cash used for gross share
repurchases; partially offset by
• A decrease in net cash sourced from debt transactions of
$1,764 million driven by a lower level of issuances in the current
year; and
• An increase in dividend payments of $632million.
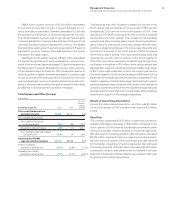
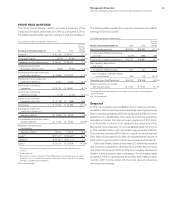
Noncurrent Assets and Liabilities
($ inmillions)
At December 31: 2015 2014
Noncurrent assets $67,991 $69,894* **
Long-term debt $33,428 $34,991**
Noncurrent liabilities (excluding debt) $28,374 $30,686*
* Reclassified to reflect adoption of the FASB guidance on deferred taxes in
consolidated financial statements. Refer to noteB, “Accounting Changes,” for
additional information.
** Reclassified to reflect adoption of the FASB guidance on debt issuance costs in
consolidated financial statements. Refer to noteB, “Accounting Changes,” for
additional information.
The decrease in noncurrent assets of $1,903 million (an increase
of $1,735 million adjusted for currency) was driven by:
• A decrease of $1,853 million ($1,417 million adjusted for
currency) in deferred taxes driven by the utilization of the tax
benefit associated with the Microelectronics divestiture; and
• A decrease of $1,096 million ($186million adjusted for cur-
rency) in long-term financing receivables; partially offset by
• An increase in goodwill of $1,466 million ($2,561 adjusted for
currency) resulting from acquisitions during the year.
Long-term debt decreased $1,563 million ($862million adjusted
for currency) driven by:
• Reclassification of $5,549 million to short-term debt to reflect
upcoming maturities; partially offset by
• Debt issuances of $4,647 million.
Other noncurrent liabilities, excluding debt, decreased $2,312 million
($387million adjusted for currency) primarily driven by:
• A decrease in retirement and nonpension postretirement
liabilities of $1,757 million driven by a currency impact of
$1,295million; and
• A decline of $635million ($207million adjusted for currency)
in other liabilities associated with a reclass to short-term
payables of a portion of the consideration payment associ-
ated with the Microelectronics divestiture.