IBM 2015 Annual Report Download - page 37
Download and view the complete annual report
Please find page 37 of the 2015 IBM annual report below. You can navigate through the pages in the report by either clicking on the pages listed below, or by using the keyword search tool below to find specific information within the annual report.-
 1
1 -
2
-
3
-
4
-
5
-
6
-
7
-
8
-
9
-
10
-
11
-
12
-
13
-
14
-
15
-
16
-
17
-
18
-
19
-
20
-
21
-
22
-
23
-
24
-
25
-
26
-
 27
27 -
 28
28 -
 29
29 -
 30
30 -
 31
31 -
 32
32 -
 33
33 -
 34
34 -
 35
35 -
 36
36 -
 37
37 -
 38
38 -
 39
39 -
 40
40 -
 41
41 -
 42
42 -
 43
43 -
 44
44 -
 45
45 -
 46
46 -
 47
47 -
48
-
49
-
50
-
51
-
52
-
53
-
54
-
55
-
56
-
57
-
58
-
59
-
60
-
61
-
62
-
63
-
64
-
65
-
66
-
67
-
68
-
69
-
70
-
71
-
72
-
73
-
74
-
75
-
76
-
77
-
78
-
79
-
80
-
81
-
82
-
83
-
84
-
85
-
86
-
87
-
88
-
89
-
90
-
91
-
92
-
93
-
94
-
95
-
96
-
97
-
98
-
99
-
100
-
101
-
102
-
103
-
104
-
105
-
106
-
107
-
108
-
109
-
110
-
111
-
112
-
113
-
114
-
115
-
116
-
117
-
118
-
119
-
120
-
121
-
122
-
123
-
124
-
125
-
126
-
127
-
128
-
129
-
130
-
131
-
132
-
133
-
134
-
135
-
136
-
137
-
138
-
139
-
140
-
141
-
142
-
143
-
144
-
145
-
146
-
147
-
148
-
149
-
150
-
151
-
152
-
153
-
154
-
155
-
156
 |
 |

35
Management Discussion
International Business Machines Corporation and Subsidiary Companies
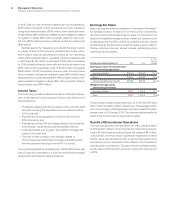
Total geographic revenue of $81,430 million in 2015 decreased
11.8percent as reported and 1percent adjusted for currency
(8points) and the divestitures of the Systemx and customer care
businesses (3points) compared to 2014. Major market coun-
tries decreased 9.9percent as reported and 1percent adjusted
for currency (8points) and the divested businesses (2points).
Within the major markets, performance varied in 2015. While the
U.S. was down compared to the prior year, revenue in Germany,
Japan and the UK grew year to year on an adjusted basis. Over-
all, growth market countries decreased 18.4percent as reported
and 3percent adjusted for currency (9points) and the divested
businesses (6points). From a regional perspective, on an adjusted
basis, growth in Latin America and the Middle East and Africa
region was more than offset by declines in the Asia Pacific growth
market countries.
Americas revenue of $38,486 million decreased 7.1percent
as reported and 2percent adjusted for currency (3points) and
divestitures (2points) compared to 2014 with a decline in North
America and growth in Latin America on an adjusted basis. The
U.S. decreased 4.4percent as reported and 3percent adjusted for
divestitures. Canada was down 17.2percent as reported and 2per-
cent adjusted for currency (13points) and divestitures (2points).
In Latin America, Brazil decreased 26.0percent as reported and
2percent adjusted for currency (22points) and the divested
businesses (2points), while Mexico had growth of 0.5percent
as reported and 14percent adjusted for currency (9points) and
divestitures (4points).
Europe/Middle East/Africa (EMEA) revenue of $26,073 million
in 2015 decreased 15.1percent as reported, but was flat year to
year adjusted for currency (13points) and the divested businesses
(3points). On an adjusted basis, there was growth in Germany
and the UK. Germany decreased 13.2percent as reported, but
grew 7percent adjusted for currency (17points) and the divested
businesses (3points). The UK decreased 6.3percent year to year
as reported, but grew 3percent adjusted for currency (7points)
and the divested businesses (2points). The Middle East and Africa
region decreased 4.8percent as reported, but grew 5percent
adjusted for the divested businesses (6points) and currency
(4points). Russia decreased 32.2percent as reported and 24per-
cent adjusted for the divestitures.
Asia Pacific revenue of $16,871 million decreased 16.5percent
as reported and 2percent adjusted for currency (9points) and the
divested businesses (6points) compared to the prior year. Japan
decreased 9.9percent as reported, but had growth of 5percent
adjusted for currency (13points) and the divested businesses
(2points). On an adjusted basis, the Japan growth was more than
offset by a decline in other markets. China decreased 34.4percent
as reported and 21percent adjusted for the divested businesses
(12points) and currency (1point). India decreased 3.8percent as
reported, but had growth of 8percent adjusted for the divested
businesses (7points) and currency (5points).
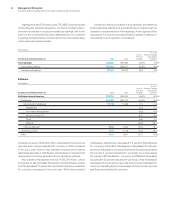
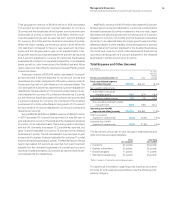
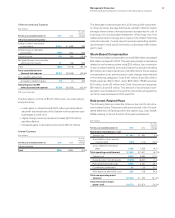
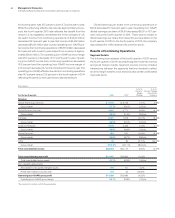
Total Expense and Other (Income)
($ inmillions)
For the year ended December 31: 2015 2014
Yr.-to-Yr.
Percent/
Margin
Change
Total consolidated expense
and other (income) $24,740 $26,421 (6.4)%
Non-operating adjustments
Amortization of acquired
intangible assets (304) (374) (18.8)
Acquisition-related charges (26) (12) 112.6
Non-operating retirement-related
(costs)/income (581) (180) 222.4
Operating (non-GAAP)
expense and other (income) $23,830 $25,855 (7.8)%
Total co nso lid ated
expense-to-revenue ratio 30.3% 28.5% 1.8 pts.
Operating (non-GAAP)
expense-to-revenue ratio 29.2% 27.9% 1.3 pts.
The key drivers of the year-to-year change in total expense and
other (income) were approximately:
Total Operating
Consolidated (non-GAAP)
• Currency* (9) points (9) points
• Systemx divestiture (2) points (2) points
• Divestiture gains 6 points 6 points
• Workforce rebalancing (3) points (3) points
* Reflects impacts of translation and hedging programs.
For additional information regarding total expense and other
(income) for both expense presentations, see the following anal-
yses by category.