IBM 2015 Annual Report Download - page 128
Download and view the complete annual report
Please find page 128 of the 2015 IBM annual report below. You can navigate through the pages in the report by either clicking on the pages listed below, or by using the keyword search tool below to find specific information within the annual report.-
 1
1 -
2
-
3
-
4
-
5
-
6
-
7
-
8
-
9
-
10
-
11
-
12
-
13
-
14
-
15
-
16
-
17
-
18
-
19
-
20
-
21
-
22
-
23
-
24
-
25
-
26
-
27
-
28
-
29
-
30
-
31
-
32
-
33
-
34
-
35
-
36
-
37
-
38
-
39
-
40
-
41
-
42
-
43
-
44
-
45
-
46
-
47
-
48
-
49
-
50
-
51
-
52
-
53
-
54
-
55
-
56
-
57
-
58
-
59
-
60
-
61
-
62
-
63
-
64
-
65
-
66
-
67
-
68
-
69
-
70
-
71
-
72
-
73
-
74
-
75
-
76
-
77
-
78
-
79
-
80
-
81
-
82
-
83
-
84
-
85
-
86
-
87
-
88
-
89
-
90
-
91
-
92
-
93
-
94
-
95
-
96
-
97
-
98
-
99
-
100
-
101
-
102
-
103
-
104
-
105
-
106
-
107
-
108
-
109
-
110
-
111
-
112
-
113
-
114
-
115
-
116
-
117
-
 118
118 -
 119
119 -
 120
120 -
 121
121 -
 122
122 -
 123
123 -
 124
124 -
 125
125 -
 126
126 -
 127
127 -
 128
128 -
 129
129 -
 130
130 -
 131
131 -
 132
132 -
 133
133 -
 134
134 -
 135
135 -
 136
136 -
 137
137 -
 138
138 -
139
-
140
-
141
-
142
-
143
-
144
-
145
-
146
-
147
-
148
-
149
-
150
-
151
-
152
-
153
-
154
-
155
-
156
 |
 |

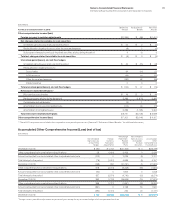
Notes to Consolidated Financial Statements
International Business Machines Corporation and Subsidiary Companies
126
PSUs are stock awards where the number of shares ulti-
mately received by the employee depends on the company’s
performance against specified targets and typically vest over a
three-year period. For PSUs, dividend equivalents are not paid.
The fair value of each PSU is determined on the grant date, based
on the company’s stock price, adjusted for the exclusion of divi-
dend equivalents, and assumes that performance targets will be
achieved. Over the performance period, the number of shares of
stock that will be issued is adjusted upward or downward based
upon the probability of achievement of performance targets. The
ultimate number of shares issued and the related compensation
cost recognized as expense will be based on a comparison of the
final performance metrics to the specified targets. The fair value
of PSUs granted at target during the years ended December31,
2015, 2014 and 2013 was $174million, $257million and $170million,
respectively. Total fair value of PSUs vested and released during
the years ended December31, 2015, 2014 and 2013 was $156mil-
lion, $161million and $156million, respectively.
In connection with vesting and release of RSUs and PSUs, the
tax benefits realized by the company for the years ended Decem-
ber31, 2015, 2014 and 2013 were $228million, $222million and
$312million, respectively.
Stock Options
Stock options are awards which allow the employee to purchase
shares of the company’s stock at a fixed price. Stock options are
granted at an exercise price equal to the company’s average high
and low stock price on the date of grant. These awards generally
vest in four equal increments on the first four anniversaries of the
grant date and have a contractual term of 10 years.
The company estimates the fair value of stock options at the
date of grant using the Black-Scholes valuation model. Key inputs
and assumptions used to estimate the fair value of stock options
include the grant price of the award, the expected option term, vol-
atility of the company’s stock, the risk-free rate and the company’s
dividend yield. Estimates of fair value are not intended to predict
actual future events or the value ultimately realized by employees
who receive equity awards, and subsequent events are not indic-
ative of the reasonableness of the original estimates of fair value
made by the company.
During the years ended December31, 2015, 2014 and 2013, the
company did not grant stock options.
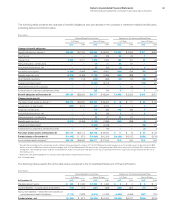
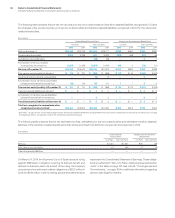
The following table summarizes option activity under the Plans
during the years ended December31, 2015, 2014 and 2013.
2015 2014 2013
Weighted-
Average
Exercise Price
Number of
Shares
Under Option
Weighted-
Average
Exercise Price
Number of
Shares
Under Option
Weighted-
Average
Exercise Price
Number of
Shares
Under Option
Balance at January1 $ 97 1,750,949 $97 5,622,951 $94 11,389,721
Options exercised 98 (1,214,109) 97 (3,740,252) 90 (5,585,127)
Options canceled/expired 100 (57,066) 95 (131,750) 86 (181,643)
Balance at December 31 $ 94 479,774 $97 1,750,949 $97 5,622,951
Exercisable at December 31 $ 94 479,774 $97 1,750,949 $97 5,622,951
The shares under option at December31, 2015 were in the following exercise price ranges:
Options Outstanding and Exercisable
Exercise Price Range
Weighted-
Average
Exercise Price
Number of
Shares
Under Option
Aggregate
Intrinsic
Value
Weighted-Average
Remaining
Contractual Life
(in Years)
$85 and under $ 83 192,959 $10,597,402 0.3
$86 and over 101 286,815 10,376,342 1.2
$ 94 479,774 $20,973,745 0.9
Exercises of Employee Stock Options
The total intrinsic value of options exercised during the years
ended December31, 2015, 2014 and 2013 was $74million,
$323million and $614million, respectively. The total cash received
from employees as a result of employee stock option exercises for
the years ended December31, 2015, 2014 and 2013 was approxi-
mately $119million, $364million and $505million, respectively. In
connection with these exercises, the tax benefits realized by the
company for the years ended December31, 2015, 2014 and 2013
were $26million, $107million and $199million, respectively.
The company settles employee stock option exercises pri-
marily with newly issued common shares and, occasionally,
with treasury shares. Total treasury shares held at December31,
2015 and 2014 were approximately 1,255 million and 1,225 million
shares, respectively.