IBM 2015 Annual Report Download - page 45
Download and view the complete annual report
Please find page 45 of the 2015 IBM annual report below. You can navigate through the pages in the report by either clicking on the pages listed below, or by using the keyword search tool below to find specific information within the annual report.-
 1
1 -
2
-
3
-
4
-
5
-
6
-
7
-
8
-
9
-
10
-
11
-
12
-
13
-
14
-
15
-
16
-
17
-
18
-
19
-
20
-
21
-
22
-
23
-
24
-
25
-
26
-
27
-
28
-
29
-
30
-
31
-
32
-
33
-
34
-
 35
35 -
 36
36 -
 37
37 -
 38
38 -
 39
39 -
 40
40 -
 41
41 -
 42
42 -
 43
43 -
 44
44 -
 45
45 -
 46
46 -
 47
47 -
 48
48 -
 49
49 -
 50
50 -
 51
51 -
 52
52 -
 53
53 -
 54
54 -
 55
55 -
56
-
57
-
58
-
59
-
60
-
61
-
62
-
63
-
64
-
65
-
66
-
67
-
68
-
69
-
70
-
71
-
72
-
73
-
74
-
75
-
76
-
77
-
78
-
79
-
80
-
81
-
82
-
83
-
84
-
85
-
86
-
87
-
88
-
89
-
90
-
91
-
92
-
93
-
94
-
95
-
96
-
97
-
98
-
99
-
100
-
101
-
102
-
103
-
104
-
105
-
106
-
107
-
108
-
109
-
110
-
111
-
112
-
113
-
114
-
115
-
116
-
117
-
118
-
119
-
120
-
121
-
122
-
123
-
124
-
125
-
126
-
127
-
128
-
129
-
130
-
131
-
132
-
133
-
134
-
135
-
136
-
137
-
138
-
139
-
140
-
141
-
142
-
143
-
144
-
145
-
146
-
147
-
148
-
149
-
150
-
151
-
152
-
153
-
154
-
155
-
156
 |
 |

43
Management Discussion
International Business Machines Corporation and Subsidiary Companies
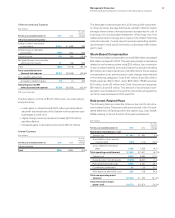
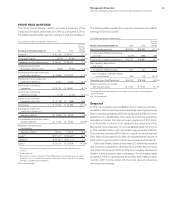
Snapshot
In the fourth quarter of 2015, the company reported $22.1billion
in revenue and delivered $4.5billion in income from continuing
operations with diluted earnings per share from continuing oper-
ations of $4.59 as reported and $4.84 on an operating (non-GAAP)
basis. The results of continuing operations exclude net income
from discontinued operations of $3million related to the divesti-
ture of the company’s Microelectronics business. The company
generated $5.3billion in cash from operations and $6.1billion in
free cash flow in the fourth quarter and continued a high level of
investment, including $2.5billion in acquisitions and driving share-
holder returns of $2.0billion in gross common stock repurchases
and dividends.
Performance in the fourth quarter continued to reflect the
transitions in the business as the company addressed both the
significant shifts in the industry as well as some of the cyclical
challenges of the global business environment.
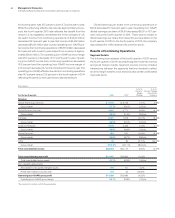
In the fourth quarter, total consolidated revenue decreased
8.5percent as reported and 2percent adjusted for currency, with
a year-to-year impact of $1.5billion due to currency. Revenue in the
strategic imperatives grew 10percent as reported and 16percent
adjusted for currency.
Within the company’s segments, total Global Services reve-
nue declined 8.1percent as reported and 1percent adjusted for
currency. Global Technology Services revenue decreased 7.1per-
cent as reported but grew 1percent adjusted for currency as the
company continues to help clients transition to a hybrid cloud
services platform bringing more mobility and security to infra-
structure services. Global Business Services revenue decreased
9.9percent (4percent adjusted for currency). GBS has continued
to add resources and transition to the strategic areas while shift-
ing away from some of the more traditional areas of the business.
Software revenue decreased 10.7percent (6percent adjusted for
currency). Software annuity content grew but transactional per-
formance continued to be impacted by the flexibility the company
has provided in Enterprise License Agreements with clients. Sys-
tems Hardware revenue decreased 1.4percent but grew 3percent
adjusted for currency driven by zSystems and Power Systems.
From a geographic perspective, revenue in the major markets
declined 6.9percent and 2percent adjusted for currency. While
the U.S. was down, revenue in Europe and Japan grew on an
adjusted basis. Growth markets revenue decreased 13.6percent
and 4percent adjusted for currency with growth in Latin America
and the Middle East and Africa region more than offset by declines
in Asia Pacific.
The consolidated gross profit margin decreased 1.6points
versus the fourth quarter of 2014 to 51.7percent. The operating
(non-GAAP) gross margin of 52.7percent decreased 1.2points
with year-to-year declines across all business segments.
Total expense and other (income) increased 9.4percent in the
fourth quarter of 2015 compared to the prior year. Total operating
(non-GAAP) expense and other (income) increased 9.2percent
year to year. The key drivers of the year-to-year change in total
expense and other (income) were approximately:
Total Operating
Consolidated (non-GAAP)
• Currency* (8) points (8) points
• Divestiture gains 23 points 24 points
• Workforce rebalancing (10) points (10) points
* Reflects impacts of translation and hedging programs.
The year-to-year increase in expense was driven by prior year
items. A gain of $1.4billion associated with the Systemx dives-
titure was recorded in the fourth quarter of 2014 and a charge
of $86million for the impairment of equity securities received as
consideration was recorded in the fourth quarter of 2015. These
items were partially offset by lower workforce rebalancing charges
of $0.6billion and the impact of currency in the fourth quarter of
2015 compared to the prior-year period.
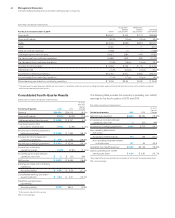
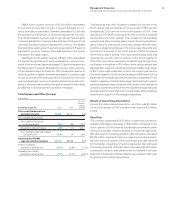
Pre-tax income from continuing operations of $5,098 million
decreased 28.1percent year to year and the pre-tax margin was
23.1percent, a decrease of 6.3points versus the fourth quarter
of 2014. The prior period gain from the Systemx divestiture rep-
resented effectively all of the year-to-year decline in the pre-tax
margin, but the margin performance also reflected higher levels
of investment, mix of contracts and resource shifts in the ser-
vices business. The continuing operations effective tax rate for