IBM 2011 Annual Report Download - page 97
Download and view the complete annual report
Please find page 97 of the 2011 IBM annual report below. You can navigate through the pages in the report by either clicking on the pages listed below, or by using the keyword search tool below to find specific information within the annual report.-
 1
1 -
2
-
3
-
4
-
5
-
6
-
7
-
8
-
9
-
10
-
11
-
12
-
13
-
14
-
15
-
16
-
17
-
18
-
19
-
20
-
21
-
22
-
23
-
24
-
25
-
26
-
27
-
28
-
29
-
30
-
31
-
32
-
33
-
34
-
35
-
36
-
37
-
38
-
39
-
40
-
41
-
42
-
43
-
44
-
45
-
46
-
47
-
48
-
49
-
50
-
51
-
52
-
53
-
54
-
55
-
56
-
57
-
58
-
59
-
60
-
61
-
62
-
63
-
64
-
65
-
66
-
67
-
68
-
69
-
70
-
71
-
72
-
73
-
74
-
75
-
76
-
77
-
78
-
79
-
80
-
81
-
82
-
83
-
84
-
85
-
86
-
 87
87 -
 88
88 -
 89
89 -
 90
90 -
 91
91 -
 92
92 -
 93
93 -
 94
94 -
 95
95 -
 96
96 -
 97
97 -
 98
98 -
 99
99 -
 100
100 -
 101
101 -
 102
102 -
 103
103 -
 104
104 -
 105
105 -
 106
106 -
 107
107 -
108
-
109
-
110
-
111
-
112
-
113
-
114
-
115
-
116
-
117
-
118
-
119
-
120
-
121
-
122
-
123
-
124
-
125
-
126
-
127
-
128
-
129
-
130
-
131
-
132
-
133
-
134
-
135
-
136
-
137
-
138
-
139
-
140
-
141
-
142
-
143
-
144
-
145
-
146
-
147
-
148
 |
 |

Notes to Consolidated Financial Statements
International Business Machines Corporation and Subsidiary Companies 95
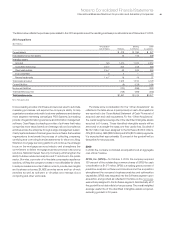
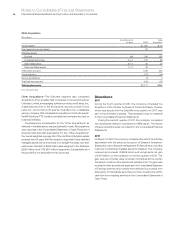
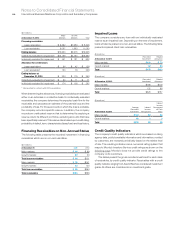
Debt and Marketable Equity Securities
The company’s cash equivalents and current debt securities are considered available-for-sale and recorded at fair value which is not materially
different from carrying value in the Consolidated Statement of Financial Position. The following tables summarize the company’s noncurrent
debt and marketable equity securities which are also considered available-for-sale and re cord ed at fair value in the Consolidated Statement
of Finan cial Position.
($ in millions)
At December 31, 2011:
Adjusted
Cost
Gross
Unrealized
Gains
Gross
Unrealized
Losses
Fair
Value
Debt securities—noncurrent (1)
Other securities $ 7 $ 1 $— $ 8
To t a l $ 7 $ 1 $— $ 8
Available-for-sale equity investments (1) $58 $27 $ (2 ) $83
(1) Included within investments and sundry assets in the Consolidated Statement of Financial Position.
($ in millions)
At December 31, 2010:
Adjusted
Cost
Gross
Unrealized
Gains
Gross
Unrealized
Losses
Fair
Value
Debt securities—noncurrent (1)
Other securities $ 6 $ 1 $(0 ) $ 7
To t a l $ 6 $ 1 $(0 ) $ 7
Available-for-sale equity investments (1) $194 $264 $(0 ) $458
(1) Included within investments and sundry assets in the Consolidated Statement of Financial Position.
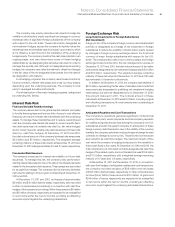
Financial Assets and Liabilities Not Measured at Fair Value
Short-Term Receivables and Payables
Notes and other accounts receivable and other investments are
financial assets with carrying values that approximate fair value.
Accounts payable, other accrued expenses and short-term debt are
financial liabilities with carrying values that approximate fair value.
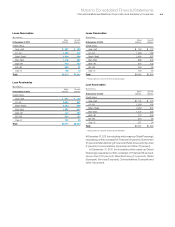
Loans and Long-Term Receivables
Fair values are based on discounted future cash flows using current
interest rates offered for similar loans to clients with similar credit
ratings for the same remaining maturities. At December 31, 2011 and
2010, the difference between the carrying amount and estimated fair
value for loans and long-term receivables was immaterial.
Long-Term Debt
Fair value of publicly traded long-term debt is based on quoted
market prices for the identical liability when traded as an asset in
an active market. For other long-term debt for which a quoted market
price is not available, an expected present value technique that uses
rates currently available to the company for debt with similar terms
and remaining maturities is used to estimate fair value. The carrying
amount of long-term debt is $22,857 million and $21,846 million
and the estimated fair value is $27,383 million and $24,006 million
at December 31, 2011 and 2010, respectively.