IBM 2011 Annual Report Download - page 37
Download and view the complete annual report
Please find page 37 of the 2011 IBM annual report below. You can navigate through the pages in the report by either clicking on the pages listed below, or by using the keyword search tool below to find specific information within the annual report.-
 1
1 -
2
-
3
-
4
-
5
-
6
-
7
-
8
-
9
-
10
-
11
-
12
-
13
-
14
-
15
-
16
-
17
-
18
-
19
-
20
-
21
-
22
-
23
-
24
-
25
-
26
-
 27
27 -
 28
28 -
 29
29 -
 30
30 -
 31
31 -
 32
32 -
 33
33 -
 34
34 -
 35
35 -
 36
36 -
 37
37 -
 38
38 -
 39
39 -
 40
40 -
 41
41 -
 42
42 -
 43
43 -
 44
44 -
 45
45 -
 46
46 -
 47
47 -
48
-
49
-
50
-
51
-
52
-
53
-
54
-
55
-
56
-
57
-
58
-
59
-
60
-
61
-
62
-
63
-
64
-
65
-
66
-
67
-
68
-
69
-
70
-
71
-
72
-
73
-
74
-
75
-
76
-
77
-
78
-
79
-
80
-
81
-
82
-
83
-
84
-
85
-
86
-
87
-
88
-
89
-
90
-
91
-
92
-
93
-
94
-
95
-
96
-
97
-
98
-
99
-
100
-
101
-
102
-
103
-
104
-
105
-
106
-
107
-
108
-
109
-
110
-
111
-
112
-
113
-
114
-
115
-
116
-
117
-
118
-
119
-
120
-
121
-
122
-
123
-
124
-
125
-
126
-
127
-
128
-
129
-
130
-
131
-
132
-
133
-
134
-
135
-
136
-
137
-
138
-
139
-
140
-
141
-
142
-
143
-
144
-
145
-
146
-
147
-
148
 |
 |

35
Management Discussion
International Business Machines Corporation and Subsidiary Companies
As discussed in the “Operating (non-GAAP) Earnings” section on
page 18, the company characterizes certain retirement-related costs
as operating and others as non-operating. Utilizing this characterization,
operating retirement-related costs in 2011 were $1,905 million, an
increase of $108 million compared to 2010, primarily driven by the
$83 million increase in defined contribution plan costs. Non-operating
costs of $(72) million increased $342 million in 2011 compared to the
prior year driven primarily by the increase in recognized actuarial
losses ($594 million), partially offset by lower interest cost ($162 million)
and the increase in expected return on plan assets ($87 million).
Income Taxes
The effective tax rate for 2011 was 24.5 percent compared with
24.8 percent in 2010. The operating (non-GAAP) tax rate for 2011
was 24.5 percent compared with 24.4 percent in 2010. The 0.3 point
decrease in the as-reported effective tax rate was primarily driven
by a more favorable geographic mix of pre-tax earnings (0.6 points),
the lack of prior year impacts related to certain intercompany
payments made by foreign subsidiaries (6.6 points) and a reduced
impact associated with the intercompany licensing of certain
intellectual property and acquisition integration costs (2.2 points).
These benefits were offset by a decrease in the utilization of foreign
tax credits (3.7 points) and a decrease in the benefits associated
with the settlements of the U.S. federal income tax audit (5.5 points).
The remaining items were individually insignificant.
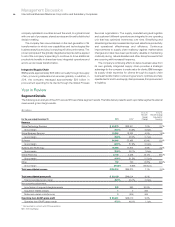
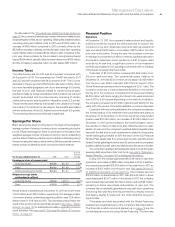
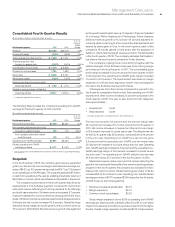
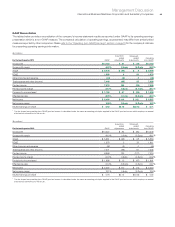
Earnings Per Share
Basic earnings per share is computed on the basis of the weighted-
average number of shares of common stock outstanding during the
period. Diluted earnings per share is computed on the basis of the
weighted-average number of shares of common stock outstanding
plus the effect of dilutive potential common shares outstanding during
the period using the treasury stock method. Dilutive potential common
shares include outstanding stock options and stock awards.
For the year ended December 31: 2011 2010
Yr.-to-Yr.
Percent
Change
Earnings per share of common stock
Assuming dilution $13.06 $11.52 13.4%
Basic $13.25 $11.69 13.3%
Diluted operating (non-GAAP) $13.44 $11.67 15.2%
Weighted-average shares
outstanding (in millions)
Assuming dilution 1,213.8 1,287.4 (5.7)%
Basic 1,197.0 1,268.8 (5.7)%
Actual shares outstanding at December 31, 2011 and 2010 were
1,163.2 million and 1,228.0 million, respectively. The average number
of common shares outstanding assuming dilution was 73.6 million
shares lower in 2011 versus 2010. The decrease was primarily the
result of the common stock repurchase program. See note L, “Equity
Activity,” on page 110 for additional information regarding common
stock activities. Also see note P, “Earnings Per Share of Common
Stock,” on page 117.
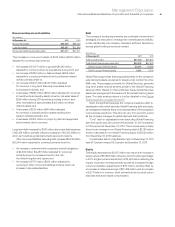
Financial Position
Dynamics
At December 31, 2011, the company’s balance sheet and liquidity
positions remain strong and are well positioned to support the
company’s long-term objectives. Cash and cash equivalents at
year end was $11,922 million, an increase of $271 million from the
prior year-end position. During the year, the company continued
to manage its investment portfolio to meet its capital preservation
and liquidity objectives, which resulted in a shift to higher rated
institutions. At year end, a significant portion of the investment
portfolio was invested in U.S. sovereign instruments with no holdings
of European sovereign debt securities.
Total debt of $31,320 million increased $2,695 million from
the prior year-end level. The commercial paper balance at
December 31, 2011 was $2,300 million, an increase of $1,156 million
from the prior year. Within total debt, $23,332 is in support of the
Global Financing business which is leveraged at a 7.2 to 1 ratio. The
company continues to have substantial flexibility in the market.
During 2011, the company completed bond issuances totaling
$4,850 million, with terms ranging from three to ten years and priced
from 0.875 to 2.90 percent depending on the maturity. In addition,
the company renewed its $10 billion global credit facility for five
years, with 100 percent of the facility available on a same day basis.
Consistent with accounting standards the company remeasures
the funded status of its retirement and postretirement plans at
December 31. At December 31, 2011, the overall net underfunded
position was $16,389 million, an increase of $2,654 million from
December 31, 2010 as the increase in the benefit obligation due to
the reduction in discount rates more than offset the returns on plan
assets. At year end, the company’s qualified defined benefit plans
were well funded and its cash requirements related to these plans
remain stable going-forward. In 2011, the return on the U.S. Personal
Pension Plan assets was 8.4 percent and the plan was 98 percent
funded. Overall, global asset returns were 6.1 percent and the company’s
qualified defined benefit plans worldwide were 96 percent funded.
The company’s qualified defined benefit plans do hold European
sovereign debt securities in their trust funds. See note S, “Retirement-
Related Benefits,” on page 129 for additional information.
During 2011, the company generated $19,846 million in cash from
operations, an increase of $298 million compared to 2010. In addition,
the company generated $16,604 million in free cash flow in 2011, an
increase of $305 million over the prior year. See pages 56 and 57
for additional information on free cash flow. The company returned
$18,519 million to shareholders in 2011, with $15,046 million in share
repurchases and $3,473 million in dividends. In 2011, the company
repurchased approximately 89 million shares and had $8.7 billion
remaining in share repurchase authorization at year end. The
company has consistently generated strong cash from operations
and strong free cash flow and this permits the company to invest
and deploy capital to areas with the most attractive long-term
opportunities.
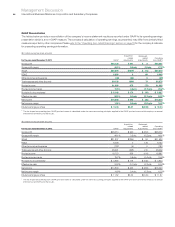
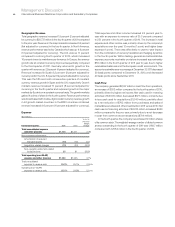
The assets and debt associated with the Global Financing
business are a significant part of the company’s financial position.
The financial position amounts appearing on page 72 are the
consolidated amounts including Global Financing. The amounts