IBM 2011 Annual Report Download - page 102
Download and view the complete annual report
Please find page 102 of the 2011 IBM annual report below. You can navigate through the pages in the report by either clicking on the pages listed below, or by using the keyword search tool below to find specific information within the annual report.-
 1
1 -
2
-
3
-
4
-
5
-
6
-
7
-
8
-
9
-
10
-
11
-
12
-
13
-
14
-
15
-
16
-
17
-
18
-
19
-
20
-
21
-
22
-
23
-
24
-
25
-
26
-
27
-
28
-
29
-
30
-
31
-
32
-
33
-
34
-
35
-
36
-
37
-
38
-
39
-
40
-
41
-
42
-
43
-
44
-
45
-
46
-
47
-
48
-
49
-
50
-
51
-
52
-
53
-
54
-
55
-
56
-
57
-
58
-
59
-
60
-
61
-
62
-
63
-
64
-
65
-
66
-
67
-
68
-
69
-
70
-
71
-
72
-
73
-
74
-
75
-
76
-
77
-
78
-
79
-
80
-
81
-
82
-
83
-
84
-
85
-
86
-
87
-
88
-
89
-
90
-
91
-
 92
92 -
 93
93 -
 94
94 -
 95
95 -
 96
96 -
 97
97 -
 98
98 -
 99
99 -
 100
100 -
 101
101 -
 102
102 -
 103
103 -
 104
104 -
 105
105 -
 106
106 -
 107
107 -
 108
108 -
 109
109 -
 110
110 -
 111
111 -
 112
112 -
113
-
114
-
115
-
116
-
117
-
118
-
119
-
120
-
121
-
122
-
123
-
124
-
125
-
126
-
127
-
128
-
129
-
130
-
131
-
132
-
133
-
134
-
135
-
136
-
137
-
138
-
139
-
140
-
141
-
142
-
143
-
144
-
145
-
146
-
147
-
148
 |
 |

Notes to Consolidated Financial Statements
International Business Machines Corporation and Subsidiary Companies100
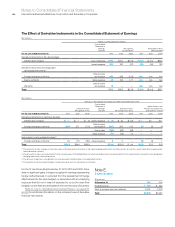
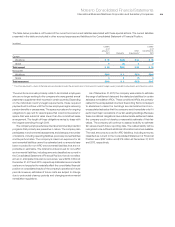
The Effect of Derivative Instruments in the Consolidated Statement of Earnings
($ in millions)
Gain/(Loss) Recognized in Earnings
Consolidated
Statement of
Earnings
Line Item
Recognized
on Derivatives(1)
Attributable to Risk
Being Hedged(2)
For the year ended December 31: 2011 2010 2009 2011 2010 2009
Derivative instruments in fair value hedges
Interest rate contracts Cost of financing $271 $241 $(172) $(117) $ (70) $344
Interest expense 205 160 (97) (89) (46) 193
Derivative instruments not designated
as hedging instruments (1)
Foreign exchange contracts
Other (income)
and expense 352 299 (128) N/A N/A N/A
Equity contracts SG&A expense 42 105 177 N/A N/A N/A
Warrants
Other (income)
and expense 10 — — N/A N/A N/A
To t a l $880 $805 $(219) $(206) $(116) $537
($ in millions)
Gain/(Loss) Recognized in Earnings and Other Comprehensive Income
Effective Portion
Recognized in OCI
Consolidated
Statement of
Earnings
Line Item
Effective Portion
Reclassified from AOCI
Ineffectiveness and
Amounts Excluded from
Effectiveness Testing(3)
For the year ended December 31: 2011 2010 2009 2011 2010 2009 2011 2010 2009
Derivative instruments in cash flow hedges
Interest rate contracts $ — $ —$ (0) Interest expense $ (8) $ (8) $ (13) $ — $— $—
Foreign exchange contracts (266) 371 (718)
Other (income)
and expense (247) (54) 143 (3) (4) (3)
Cost of sales (182) (92) (49) —— —
SG&A expense (74) (49) 14 —— —
Instruments in net investment hedges(4)
Foreign exchange contracts 45 178 (162) Interest expense 00 — (9) (3) 1
To t a l $(221) $549 $(880) $(511) $(203) $ 94 $(12) $ (7) $ (2)
(1) The amount includes changes in clean fair values of the derivative instruments in fair value hedging relationships and the periodic accrual for coupon payments required under
these derivative contracts.
(2) The amount includes basis adjustments to the carrying value of the hedged item recorded during the period and amortization of basis adjustments recorded on de-designated
hedging relationships during the period.
(3) The amount of gain/(loss) recognized in income represents ineffectiveness on hedge relationships.
(4) Instruments in net investment hedges include derivative and non-derivative instruments.
For the 12 months ending December 31, 2011, 2010 and 2009, there
were no significant gains or losses recognized in earnings representing
hedge ineffectiveness or excluded from the assessment of hedge
effectiveness (for fair value hedges), or associated with an underlying
exposure that did not or was not expected to occur (for cash flow
hedges); nor are there any anticipated in the normal course of business.
Refer to note A, “Significant Accounting Policies,” on pages 83
and 84 for additional information on the company’s use of derivative
financial instruments.
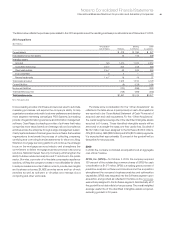
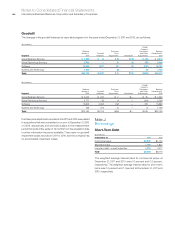
Note E.
Inventories
($ in millions)
At December 31: 2011 2010
Finished goods $ 589 $ 432
Work in process and raw materials 2,007 2,018
To t a l $2,595 $2,450