IBM 2011 Annual Report Download - page 59
Download and view the complete annual report
Please find page 59 of the 2011 IBM annual report below. You can navigate through the pages in the report by either clicking on the pages listed below, or by using the keyword search tool below to find specific information within the annual report.-
 1
1 -
2
-
3
-
4
-
5
-
6
-
7
-
8
-
9
-
10
-
11
-
12
-
13
-
14
-
15
-
16
-
17
-
18
-
19
-
20
-
21
-
22
-
23
-
24
-
25
-
26
-
27
-
28
-
29
-
30
-
31
-
32
-
33
-
34
-
35
-
36
-
37
-
38
-
39
-
40
-
41
-
42
-
43
-
44
-
45
-
46
-
47
-
48
-
 49
49 -
 50
50 -
 51
51 -
 52
52 -
 53
53 -
 54
54 -
 55
55 -
 56
56 -
 57
57 -
 58
58 -
 59
59 -
 60
60 -
 61
61 -
 62
62 -
 63
63 -
 64
64 -
 65
65 -
 66
66 -
 67
67 -
 68
68 -
 69
69 -
70
-
71
-
72
-
73
-
74
-
75
-
76
-
77
-
78
-
79
-
80
-
81
-
82
-
83
-
84
-
85
-
86
-
87
-
88
-
89
-
90
-
91
-
92
-
93
-
94
-
95
-
96
-
97
-
98
-
99
-
100
-
101
-
102
-
103
-
104
-
105
-
106
-
107
-
108
-
109
-
110
-
111
-
112
-
113
-
114
-
115
-
116
-
117
-
118
-
119
-
120
-
121
-
122
-
123
-
124
-
125
-
126
-
127
-
128
-
129
-
130
-
131
-
132
-
133
-
134
-
135
-
136
-
137
-
138
-
139
-
140
-
141
-
142
-
143
-
144
-
145
-
146
-
147
-
148
 |
 |

57
Management Discussion
International Business Machines Corporation and Subsidiary Companies
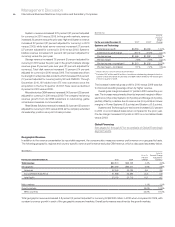
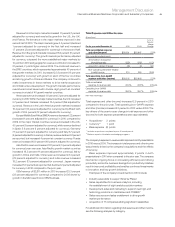
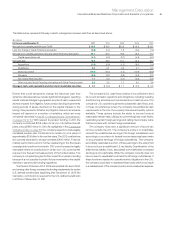
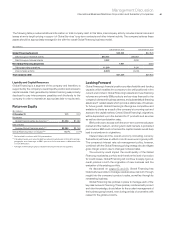
The table below represents the way in which management reviews cash flow as described above.
($ in billions)
For the year ended December 31: 2011 2010 2009 2008 2007
Net cash from operating activities per GAAP $ 19.8 $ 19.5 $20.8 $ 18.8 $ 16.1
Less: the change in Global Financing receivables (0.8) (0.7) 1.9 (0.0) (1.3)
Net cash from operating activities, excluding Global Financing receivables 20.7 20.3 18.9 18.8 17.4
Capital expenditures, net (4.1) (4.0) (3.7) (4.5)(5.0)
Free cash flow 16.6 16.3 15.1 14.3 12.4
Acquisitions (1.8) (5.9) (1.2) (6.3)(1.0)
Divestitures 0.0 0.1 0.4 0.1 0.3
Share repurchase (15.0) (15.4) (7.4) (10.6)(18.8)
Dividends (3.5) (3.2) (2.9) (2.6) (2.1)
Non-Global Financing debt 1.7 2.3 (4.7) (3.2)10.9
Other (includes Global Financing receivables and Global Financing debt) 2.3 3.5 1.7 5.0 3.8
Change in cash, cash equivalents and short-term marketable securities $ 0.3 $ (2.3)$ 1.1 $ (3.2)$ 5.5
Events that could temporarily change the historical cash flow
dynamics discussed above include significant changes in operating
results, material changes in geographic sources of cash, unexpected
adverse impacts from litigation, future pension funding requirements
during periods of severe downturn in the capital markets or the
timing of tax payments. Whether any litigation has such an adverse
impact will depend on a number of variables, which are more
completely described in note M, “Contingencies and Commitments,”
on pages 112 to 114. With respect to pension funding, in 2011, the
company contributed $798 million to its non-U.S. defined benefit
plans, versus $865 million in 2010. As highlighted in the Contractual
Obligations table on page 58, the company expects to make legally
mandated pension plan contributions to certain non-U.S. plans of
approximately $3.9 billion in the next five years. The 2012 contributions
are currently expected to be approximately $800 million. Financial
market performance and/or further weakening in the European
sovereign debt credit environment in 2012 could increase the legally
mandated minimum contributions in certain non-U.S. countries that
require more frequent remeasurement of the funded status. The
company is not quantifying any further impact from pension funding
because it is not possible to predict future movements in the capital
markets or pension plan funding regulations.
The Pension Protection Act of 2006 was enacted into law in 2006,
and, among other things, increases the funding requirements for certain
U.S. defined benefit plans beginning after December 31, 2007. No
mandatory contribution is required for the U.S. defined benefit plan
in 2012 as of December 31, 2011.
The company’s U.S. cash flows continue to be sufficient to fund
its current domestic operations and obligations, including investing
and financing activities such as dividends and debt service. The
company’s U.S. operations generate substantial cash flows, and,
in those circumstances where the company has additional cash
requirements in the U.S., the company has several liquidity options
available. These options include the ability to borrow funds at
reasonable interest rates, utilizing its committed global credit facility,
repatriating certain foreign earnings and calling intercompany loans
that are in place with certain foreign subsidiaries.
The company does earn a significant amount of its pre-tax
income outside the U.S. The company’s policy is to indefinitely
reinvest the undistributed earnings of its foreign subsidiaries, and
accordingly, no provision for federal income taxes has been made
on accumulated earnings of foreign subsidiaries. The company
periodically repatriates a portion of these earnings to the extent that
it does not incur an additional U.S. tax liability. Quantification of the
deferred tax liability, if any, associated with indefinitely reinvested
earnings is not practicable. While the company currently does not
have a need to repatriate funds held by its foreign subsidiaries, if
these funds are needed for operations and obligations in the U.S.,
the company could elect to repatriate these funds which could result
in a reassessment of the company’s policy and increased tax expense.