IBM 2011 Annual Report Download - page 136
Download and view the complete annual report
Please find page 136 of the 2011 IBM annual report below. You can navigate through the pages in the report by either clicking on the pages listed below, or by using the keyword search tool below to find specific information within the annual report.-
 1
1 -
2
-
3
-
4
-
5
-
6
-
7
-
8
-
9
-
10
-
11
-
12
-
13
-
14
-
15
-
16
-
17
-
18
-
19
-
20
-
21
-
22
-
23
-
24
-
25
-
26
-
27
-
28
-
29
-
30
-
31
-
32
-
33
-
34
-
35
-
36
-
37
-
38
-
39
-
40
-
41
-
42
-
43
-
44
-
45
-
46
-
47
-
48
-
49
-
50
-
51
-
52
-
53
-
54
-
55
-
56
-
57
-
58
-
59
-
60
-
61
-
62
-
63
-
64
-
65
-
66
-
67
-
68
-
69
-
70
-
71
-
72
-
73
-
74
-
75
-
76
-
77
-
78
-
79
-
80
-
81
-
82
-
83
-
84
-
85
-
86
-
87
-
88
-
89
-
90
-
91
-
92
-
93
-
94
-
95
-
96
-
97
-
98
-
99
-
100
-
101
-
102
-
103
-
104
-
105
-
106
-
107
-
108
-
109
-
110
-
111
-
112
-
113
-
114
-
115
-
116
-
117
-
118
-
119
-
120
-
121
-
122
-
123
-
124
-
125
-
 126
126 -
 127
127 -
 128
128 -
 129
129 -
 130
130 -
 131
131 -
 132
132 -
 133
133 -
 134
134 -
 135
135 -
 136
136 -
 137
137 -
 138
138 -
 139
139 -
 140
140 -
 141
141 -
 142
142 -
 143
143 -
 144
144 -
 145
145 -
 146
146 -
147
-
148
 |
 |

Notes to Consolidated Financial Statements
International Business Machines Corporation and Subsidiary Companies134
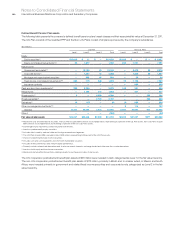
subsidy of $96 million to the plan in order to reduce contributions
required by the participants. The company received total subsidies
of $36 million and $45 million for prescription drug-related coverage
during the years ended December 31, 2011 and 2010, respectively,
which were utilized to reduce the company contributions to the U.S.
nonpension postretirement benefit plan.
The company has included the impact of its portion of the subsidy
in the determination of net periodic cost and APBO for the U.S.
nonpension postretirement benefit plan at and for the years ended
December 31, 2011, 2010 and 2009. The impact of the subsidy
resulted in a reduction in APBO of $93 million and $107 million at
December 31, 2011 and 2010, respectively. The impact of the subsidy
resulted in a reduction in 2011, 2010 and 2009 net periodic cost of
$37 million, $19 million and $28 million, respectively.
The 2012 expected benefit payments to nonpension postretirement
benefit plan participants not covered by the respective plan assets
represent a component of compensation and benefits, within current
liabilities, in the Consolidated Statement of Financial Position.
Medicare Prescription Drug Act
In connection with the Medicare Prescription Drug Improvement
and Modernization Act of 2003, the company is expected to continue
to receive a federal subsidy of approximately $196 million to subsidize
the prescription drug coverage provided by the U.S. nonpension
postretirement benefit plan, which is expected to extend until 2015.
Approx imately $100 million of the subsidy will be used by the company
to reduce its obligation and cost related to the U.S. nonpension
postretirement benefit plan. The company will contribute the remaining
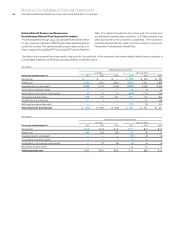
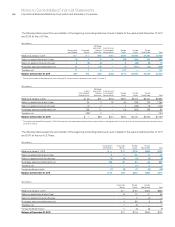
Expected Benefit Payments
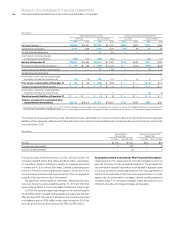
Defined Benefit Pension Plan Expected Payments
The following table presents the total expected benefit payments to defined benefit pension plan participants. These payments have been
estimated based on the same assumptions used to measure the plans’ PBO at December 31, 2011 and include benefits attributable to
estimated future compensation increases, where applicable.
($ in millions)
Qualified
U.S. Plan
Payments
Nonqualified
U.S. Plans
Payments
Qualified
Non-U.S. Plans
Payments
Nonqualified
Non-U.S. Plans
Payments
Tot a l
Expected
Benefit
Payments
2012 $ 3,273 $ 98 $ 2,015 $ 348 $ 5,735
2013 3,313 102 1,996 354 5,765
2014 3,353 105 2,000 358 5,816
2015 3,420 108 2,024 368 5,920
2016 3,401 110 2,068 377 5,957
2017–2021 17,261 579 10,767 2,110 30,718
The 2012 expected benefit payments to defined benefit pension plan participants not covered by the respective plan assets (underfunded
plans) represent a component of compensation and benefits, within current liabilities, in the Consolidated Statement of Financial Position.
Nonpension Postretirement Benefit Plan Expected Payments
The following table reflects the total expected benefit payments to nonpension postretirement benefit plan participants, as well
as the expected receipt of the company’s share of the Medicare subsidy described below. These payments have been estimated based on
the same assumptions used to measure the plan’s APBO at December 31, 2011.
($ in millions)
U.S. Plan
Payments
Less: IBM
Share of
Expected
Medicare
Subsidy
Net Expected
U.S. Plan
Payments
Qualified
Non-U.S. Plans
Payments
Nonqualified
Non-U.S. Plans
Payments
Tot a l
Expected
Benefit
Payments
2012 $ 492 $(26) $ 466 $ 7 $ 32 $ 505
2013 509 (26) 483 8 36 527
2014 448 (25) 423 9 39 471
2015 432 (23) 409 10 42 461
2016 425 — 425 10 45 480
2017–2021 2,003 — 2,003 63 282 2,348