IBM 2011 Annual Report Download - page 125
Download and view the complete annual report
Please find page 125 of the 2011 IBM annual report below. You can navigate through the pages in the report by either clicking on the pages listed below, or by using the keyword search tool below to find specific information within the annual report.-
 1
1 -
2
-
3
-
4
-
5
-
6
-
7
-
8
-
9
-
10
-
11
-
12
-
13
-
14
-
15
-
16
-
17
-
18
-
19
-
20
-
21
-
22
-
23
-
24
-
25
-
26
-
27
-
28
-
29
-
30
-
31
-
32
-
33
-
34
-
35
-
36
-
37
-
38
-
39
-
40
-
41
-
42
-
43
-
44
-
45
-
46
-
47
-
48
-
49
-
50
-
51
-
52
-
53
-
54
-
55
-
56
-
57
-
58
-
59
-
60
-
61
-
62
-
63
-
64
-
65
-
66
-
67
-
68
-
69
-
70
-
71
-
72
-
73
-
74
-
75
-
76
-
77
-
78
-
79
-
80
-
81
-
82
-
83
-
84
-
85
-
86
-
87
-
88
-
89
-
90
-
91
-
92
-
93
-
94
-
95
-
96
-
97
-
98
-
99
-
100
-
101
-
102
-
103
-
104
-
105
-
106
-
107
-
108
-
109
-
110
-
111
-
112
-
113
-
114
-
 115
115 -
 116
116 -
 117
117 -
 118
118 -
 119
119 -
 120
120 -
 121
121 -
 122
122 -
 123
123 -
 124
124 -
 125
125 -
 126
126 -
 127
127 -
 128
128 -
 129
129 -
 130
130 -
 131
131 -
 132
132 -
 133
133 -
 134
134 -
 135
135 -
136
-
137
-
138
-
139
-
140
-
141
-
142
-
143
-
144
-
145
-
146
-
147
-
148
 |
 |

Notes to Consolidated Financial Statements
International Business Machines Corporation and Subsidiary Companies 123
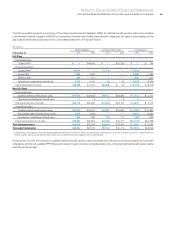
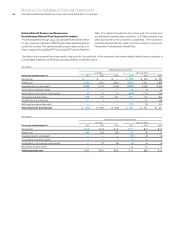
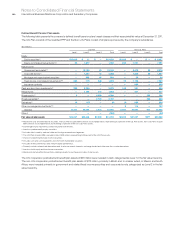
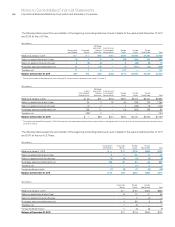
The following table presents a summary of the total projected benefit obligation (PBO) for defined benefit pension plans, accumulated
postretirement benefit obligation (APBO) for nonpension postretirement benefit plans (benefit obligations), fair value of plan assets and the
associated funded status recorded in the Consolidated Statement of Financial Position.
($ in millions)
Benefit Obligations Fair Value of Plan Assets Funded Status*
At December 31: 2011 2010 2011 2010 2011 2010
U.S. Plans
Overfunded plans
Qualified PPP $ — $49,663 $ — $ 50,259 $ — $ 596
Underfunded plans
Qualified PPP 52,318 —51,218 —(1,100) —
Excess PPP 1,462 1,360 ——(1,462) (1,360)
Retention Plan 305 271 ——(305) (271)
Nonpension postretirement benefit plan 5,273 5,123 38 35 (5,235) (5,088)
Total underfunded U.S. plans $59,358 $ 6,753 $51,256 $ 35 $ (8,102) $ (6,718)
Non-U.S. Plans
Overfunded plans
Qualified defined benefit pension plans $13,169 $22,625 $16,011 $25,096 $ 2,843 $ 2,471
Nonpension postretirement benefit plans 787901
Total overfunded non-U.S. plans $13,175 $22,633 $16,018 $25,105 $ 2,843 $ 2,472
Underfunded plans
Qualified defined benefit pension plans $24,659 $14,507 $19,351 $10,626 $ (5,308) $ (3,881)
Nonqualified defined benefit pension plans 5,033 5,452 ——(5,033) (5,452)
Nonpension postretirement benefit plans 894 864 105 111 (789) (753)
Total underfunded non-U.S. plans $30,587 $20,823 $19,456 $10,737 $(11,131) $(10,086)
Total overfunded plans $13,175 $72,296 $16,018 $75,364 $ 2,843 $ 3,068
Total underfunded plans $89,944 $27,576 $70,712 $10,772 $(19,232) $(16,804)
*
Funded status is recognized in the Consolidated Statement of Financial Position as follows: Asset amounts as prepaid pension assets; (Liability) amounts as compensation and
benefits (current liability) and retirement and nonpension postretirement benefit obligations (noncurrent liability).
At December 31, 2011, the company’s qualified defined benefit pension plans worldwide were 96 percent funded compared to the benefit
obligations, with the U.S. qualified PPP 98 percent funded. Overall, including nonqualifed plans, the company’s defined benefit pension plans
were 89 percent funded.