IBM 2011 Annual Report Download - page 20
Download and view the complete annual report
Please find page 20 of the 2011 IBM annual report below. You can navigate through the pages in the report by either clicking on the pages listed below, or by using the keyword search tool below to find specific information within the annual report.-
 1
1 -
2
-
3
-
4
-
5
-
6
-
7
-
8
-
9
-
 10
10 -
 11
11 -
 12
12 -
 13
13 -
 14
14 -
 15
15 -
 16
16 -
 17
17 -
 18
18 -
 19
19 -
 20
20 -
 21
21 -
 22
22 -
 23
23 -
 24
24 -
 25
25 -
 26
26 -
 27
27 -
 28
28 -
 29
29 -
 30
30 -
31
-
32
-
33
-
34
-
35
-
36
-
37
-
38
-
39
-
40
-
41
-
42
-
43
-
44
-
45
-
46
-
47
-
48
-
49
-
50
-
51
-
52
-
53
-
54
-
55
-
56
-
57
-
58
-
59
-
60
-
61
-
62
-
63
-
64
-
65
-
66
-
67
-
68
-
69
-
70
-
71
-
72
-
73
-
74
-
75
-
76
-
77
-
78
-
79
-
80
-
81
-
82
-
83
-
84
-
85
-
86
-
87
-
88
-
89
-
90
-
91
-
92
-
93
-
94
-
95
-
96
-
97
-
98
-
99
-
100
-
101
-
102
-
103
-
104
-
105
-
106
-
107
-
108
-
109
-
110
-
111
-
112
-
113
-
114
-
115
-
116
-
117
-
118
-
119
-
120
-
121
-
122
-
123
-
124
-
125
-
126
-
127
-
128
-
129
-
130
-
131
-
132
-
133
-
134
-
135
-
136
-
137
-
138
-
139
-
140
-
141
-
142
-
143
-
144
-
145
-
146
-
147
-
148
 |
 |

18
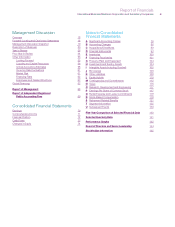
Management Discussion
International Business Machines Corporation and Subsidiary Companies
Overview
The financial section of the International Business Machines
Cor por ation (IBM or the company) 2011 Annual Report includes the
Management Discussion, the Consolidated Financial State ments and
the Notes to the Consolidated Financial State ments. This Over view
is designed to provide the reader with some perspective regarding
the information contained in the financial section.
Organization of Information
• The Management Discussion is designed to provide readers
with an overview of the business and a narrative on the
company’s financial results and certain factors that may affect
its future prospects from the perspective of the company’s
management. The “Management Discussion Snap shot” on pages
19 and 20, presents an overview of the key performance drivers
in 2011.
•
Beginning with the “Year in Review” on page 26, the Manage ment
Discussion contains the results of operations for each reportable
segment of the business and a discussion of the company’s
financial position and cash flows. Other key sections within the
Management Discussion include: “Looking Forward” on page
55, and “Liquidity and Capital Resources” on pages 56 to 58. It
is useful to read the Management Dis cussion in conjunction with
note T, “Segment Information,” on pages 135 to 139.
•
Global Financing is a reportable segment that is measured as a
stand-alone entity. A separate “Global Financing” section is
included beginning on page 63.
•
The Consolidated Financial Statements are presented on pages
70 through 75. These statements provide an overview of the
company’s income and cash flow performance and its financial
position.
•
The Notes follow the Consolidated Financial Statements. Among
other items, the Notes contain the company’s accounting policies
(pages 76 to 86), acquisitions and divestitures (pages 89 to 93),
detailed information on specific items within the financial statements,
certain contingencies and commitments (pages 112 to 115) and
retirement-related benefits information (pages 121 to 135).
• The Consolidated Financial Statements and the Notes have been
prepared in accordance with accounting principles generally
accepted in the United States (GAAP).
• The references to “adjusted for currency” or “at constant currency”
in the Management Discussion do not include operational
impacts that could result from fluctuations in foreign currency
rates. Certain financial results are adjusted based on a simple
mathematical model that translates current period results in local
currency using the comparable prior year period’s currency
conversion rate. This approach is used for countries where the
functional currency is the local country currency. This information
is provided so that certain financial results can be viewed without
the impact of fluctuations in foreign currency rates, thereby
facilitating period-to-period comparisons of business performance.
See “Currency Rate Fluctuations” on page 61 for additional
information.
• Within the financial statements and tables in this Annual Report,
certain columns and rows may not add due to the use of rounded
numbers for disclosure purposes. Percentages reported are
calculated from the underlying whole-dollar numbers.
Operating (non-GAAP) Earnings
In an effort to provide better transparency into the operational results
of the business, the company separated business results into
operating and non-operating categories beginning January 1, 2011.
Operating earnings is a non-GAAP measure that excludes the effects
of certain acquisition-related charges and retirement-related costs,
and their related tax impacts. For acquisitions, operating earnings
exclude the amortization of purchased intangible assets and
acquisition-related charges such as in-process research and
development, transaction costs, applicable restructuring and related
expenses and tax charges related to acquisition integration. For
retirement-related costs, the company has characterized certain
items as operating and others as non-operating. The company
includes defined benefit plan and nonpension postretirement benefit
plan service cost, amortization of prior service cost and the cost of
defined contribution plans in operating earnings. Non-operating
retirement-related cost includes defined benefit plan and nonpension
postretirement benefit plan interest cost, expected return on plan
assets, amortized actuarial gains/losses, the impacts of any plan
curtailments/settlements and multi-employer plan costs, pension
insolvency costs and other costs. Non-operating costs are primarily
related to changes in pension plan assets and liabilities which are
tied to financial market performance and the company considers
these costs to be outside the operational performance of the business.
Overall, the company believes that providing investors with a view
of operating earnings as described above provides increased
transparency and clarity into both the operational results of the
business and the performance of the company’s pension plans;
improves visibility to management decisions and their impacts
on operational performance; enables better comparison to peer
companies; and allows the company to provide a long-term strategic
view of the business going forward. For its 2015 earnings per share
Road Map, the company is utilizing an operating view to establish
its objectives and track its progress. Effective January 1, 2011, the
company’s segment financial results and performance reflect
operating earnings, consistent with the company’s management
and measurement system. The 2010 and 2009 financial results
in this Annual Report have been reclassified to conform with the
2011 presentation of business results into operating and non-
operating categories.
Forward-Looking
and Cautionary Statements
Certain statements contained in this Annual Report may constitute
forward-looking statements within the meaning of the Private
Secur ities Litigation Reform Act of 1995. Any forward-looking statement
in this Annual Report speaks only as of the date on which it is made;
the company assumes no obligation to update or revise any such