IBM 2011 Annual Report Download - page 29
Download and view the complete annual report
Please find page 29 of the 2011 IBM annual report below. You can navigate through the pages in the report by either clicking on the pages listed below, or by using the keyword search tool below to find specific information within the annual report.-
 1
1 -
2
-
3
-
4
-
5
-
6
-
7
-
8
-
9
-
10
-
11
-
12
-
13
-
14
-
15
-
16
-
17
-
18
-
 19
19 -
 20
20 -
 21
21 -
 22
22 -
 23
23 -
 24
24 -
 25
25 -
 26
26 -
 27
27 -
 28
28 -
 29
29 -
 30
30 -
 31
31 -
 32
32 -
 33
33 -
 34
34 -
 35
35 -
 36
36 -
 37
37 -
 38
38 -
 39
39 -
40
-
41
-
42
-
43
-
44
-
45
-
46
-
47
-
48
-
49
-
50
-
51
-
52
-
53
-
54
-
55
-
56
-
57
-
58
-
59
-
60
-
61
-
62
-
63
-
64
-
65
-
66
-
67
-
68
-
69
-
70
-
71
-
72
-
73
-
74
-
75
-
76
-
77
-
78
-
79
-
80
-
81
-
82
-
83
-
84
-
85
-
86
-
87
-
88
-
89
-
90
-
91
-
92
-
93
-
94
-
95
-
96
-
97
-
98
-
99
-
100
-
101
-
102
-
103
-
104
-
105
-
106
-
107
-
108
-
109
-
110
-
111
-
112
-
113
-
114
-
115
-
116
-
117
-
118
-
119
-
120
-
121
-
122
-
123
-
124
-
125
-
126
-
127
-
128
-
129
-
130
-
131
-
132
-
133
-
134
-
135
-
136
-
137
-
138
-
139
-
140
-
141
-
142
-
143
-
144
-
145
-
146
-
147
-
148
 |
 |

27
Management Discussion
International Business Machines Corporation and Subsidiary Companies
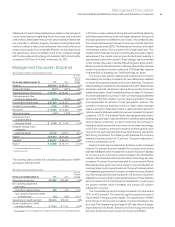
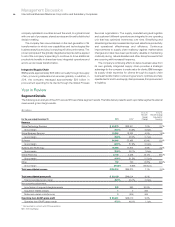
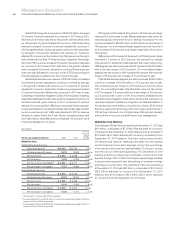
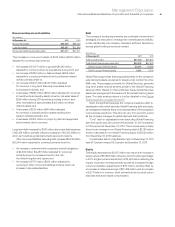
The following table presents each reportable segment’s external revenue as a percentage of total segment external revenue and each
reportable segment’s pre-tax income as a percentage of total segment pre-tax income.
Revenue Pre-tax Income*+
For the year ended December 31: 2011 2010 2011 2010
Global Technology Services 38.5% 38.5%27.4% 26.3%
Global Business Services 18.2 18.4 13.1 12.2
Total Global Services 56.7 56.9 40.6 38.4
Software 23.5 22.7 43.5 45.2
Systems and Technology 17.9 18.1 7.1 7.0
Global Financing 2.0 2.3 8.8 9.4
To t a l 100.0% 100.0%100.0% 100.0%
*
Segment pre-tax income includes transactions between segments that are intended to reflect an arm’s-length transfer price and excludes certain unallocated corporate items;
see note T, “Segment Information,” on pages 135 to 139 for additional information.
+ Reclassified to conform with 2011 presentation.
revenue in 2011, an increase of 6.6 percent (2 percent adjusted for
currency) compared to 2010. Services revenue performance, adjusted
for currency, was consistent over the course of the year driven
by stability in the backlog. Performance in 2011 was led by strength
in the growth markets with total services revenue up 16.9 percent
(11 percent adjusted for currency) and gross margin 2 points higher
than in the major markets. The services segments also had good
performance in the other key growth initiatives: cloud, business analytics
and Smarter Planet. Total outsourcing revenue of $28,301 million,
which includes GTS Outsourcing and GBS Application Management
Services Outsourcing, increased 7.8 percent (3 percent adjusted for
currency) and total transactional revenue of $24,348 million, which
includes Consulting and Systems Integration within GBS and Integrated
Technology Services within GTS, increased 6.2 percent (2 percent
adjusted for currency) year to year.
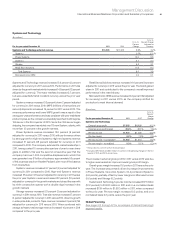
($ in millions)
For the year ended December 31: 2011 2010*
Yr.-to-Yr.
Percent
Change
Yr.-to-Yr.
Percent Change
Adjusted for
Currency
Global Services external revenue $60,163 $56,424 6.6%2.3%
Global Technology Services $40,879 $38,201 7.0%2.7%
Outsourcing 23,911 22,241 7.5 3.0
Integrated Technology Services 9,453 8,714 8.5 4.1
Maintenance 7,515 7,250 3.6 (0.2)
Global Business Services $19,284 $18,223 5.8%1.5%
Outsourcing 4,390 4,007 9.5 4.8
Consulting and Systems Integration 14,895 14,216 4.8 0.5
* Reclassified to conform with 2011 presentation of Outsourcing and Consulting and Systems Integration revenue within GBS.
The Product Lifecycle Management (PLM) transaction gain recorded
in the first quarter of 2010 impacted the year-to-year results of the
company’s reportable segments for 2011 compared to 2010. In
addition, workforce rebalancing charges were incurred in every
segment in the first quarter of both years. The PLM transaction gain
($591 million) was recorded in Software in the first quarter of 2010.
In the segment analysis below and in the Global Financing analysis
on pages 63 and 64, each segment’s pre-tax income and pre-tax
margin for 2011 and 2010 is presented on an as-reported basis and
on a basis normalized for these actions in both years to provide a better
perspective of the underlying operational performance of the segments.
Global Services
The Global Services segments, Global Technology Services (GTS)
and Global Business Services (GBS), delivered $60,163 million of