IBM 2011 Annual Report Download - page 58
Download and view the complete annual report
Please find page 58 of the 2011 IBM annual report below. You can navigate through the pages in the report by either clicking on the pages listed below, or by using the keyword search tool below to find specific information within the annual report.-
 1
1 -
2
-
3
-
4
-
5
-
6
-
7
-
8
-
9
-
10
-
11
-
12
-
13
-
14
-
15
-
16
-
17
-
18
-
19
-
20
-
21
-
22
-
23
-
24
-
25
-
26
-
27
-
28
-
29
-
30
-
31
-
32
-
33
-
34
-
35
-
36
-
37
-
38
-
39
-
40
-
41
-
42
-
43
-
44
-
45
-
46
-
47
-
 48
48 -
 49
49 -
 50
50 -
 51
51 -
 52
52 -
 53
53 -
 54
54 -
 55
55 -
 56
56 -
 57
57 -
 58
58 -
 59
59 -
 60
60 -
 61
61 -
 62
62 -
 63
63 -
 64
64 -
 65
65 -
 66
66 -
 67
67 -
 68
68 -
69
-
70
-
71
-
72
-
73
-
74
-
75
-
76
-
77
-
78
-
79
-
80
-
81
-
82
-
83
-
84
-
85
-
86
-
87
-
88
-
89
-
90
-
91
-
92
-
93
-
94
-
95
-
96
-
97
-
98
-
99
-
100
-
101
-
102
-
103
-
104
-
105
-
106
-
107
-
108
-
109
-
110
-
111
-
112
-
113
-
114
-
115
-
116
-
117
-
118
-
119
-
120
-
121
-
122
-
123
-
124
-
125
-
126
-
127
-
128
-
129
-
130
-
131
-
132
-
133
-
134
-
135
-
136
-
137
-
138
-
139
-
140
-
141
-
142
-
143
-
144
-
145
-
146
-
147
-
148
 |
 |

56
Management Discussion
International Business Machines Corporation and Subsidiary Companies
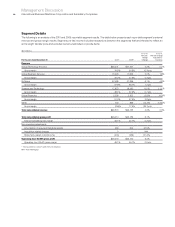
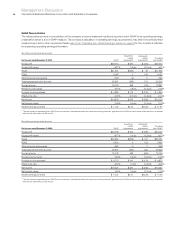
Liquidity and Capital Resources
The company has consistently generated strong cash flow from
operations, providing a source of funds ranging between $16.1 billion
and $20.8 billion per year over the past five years. The company
provides for additional liquidity through several sources: maintaining
an adequate cash balance, access to global funding sources, a
committed global credit facility and other committed and uncommitted
lines of credit worldwide. The following table provides a summary of
the major sources of liquidity for the years ended December 31, 2007
through 2011.
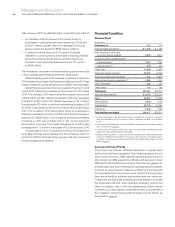
Cash Flow and Liquidity Trends
($ in billions)
2011 2010 2009 2008 2007
Net cash from
operating activities $19.8 $19.5 $20.8 $18.8 $16.1
Cash and short-term
marketable securities $11.9 $11.7 $14.0 $12.9 $16.1
Committed global
credit facilities $10.0 $10.0 $10.0 $10.0 $10.0
The major rating agencies’ ratings on the company’s debt securities
at December 31, 2011 appear in the following table and remain
unchanged from December 31, 2010. The company’s debt securities
do not contain any acceleration clauses which could change the
scheduled maturities of the obligation. In addition, the company does
not have “ratings trigger” provisions in its debt covenants or
documentation, which would allow the holders to declare an event
of default and seek to accelerate payments thereunder in the event
of a change in credit rating. The company’s contractual agreements
governing derivative instruments contain standard market clauses
which can trigger the termination of the agreement if the company’s
credit rating were to fall below investment grade. At December 31, 2011,
the fair value of those instruments that were in a liability position was
$531 million, before any applicable netting, and this position is subject
to fluctuations in fair value period to period based on the level of the
company’s outstanding instruments and market conditions. The
company has no other contractual arrangements that, in the event
of a change in credit rating, would result in a material adverse effect
on its financial position or liquidity.
Standard
& Poor’s
Moody’s
Investors
Service
Fitch
Ratings
Senior long-term debt A+ Aa3 A+
Commercial paper A-1 Prime-1 F1
The company prepares its Consolidated Statement of Cash Flows
in accordance with applicable accounting standards for cash flow
presentation on page 73 and highlights causes and events underlying
sources and uses of cash in that format on page 36. For purposes
of running its business, the company manages, monitors and analyzes
cash flows in a different format.
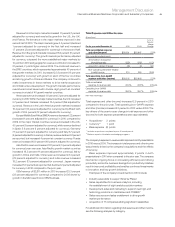
Management uses a free cash flow measure to evaluate the
company’s operating results, plan share repurchase levels, evaluate
strategic investments and assess the company’s ability and need
to incur and service debt. Free cash flow is not a defined term under
GAAP and it should not be inferred that the entire free cash flow
amount is available for discretionary expenditures. The company
defines free cash flow as net cash from operating activities less the
change in Global Financing receivables and net capital expenditures,
including the investment in software. As discussed on page 24, a
key objective of the Global Financing business is to generate strong
returns on equity. Increasing receivables is the basis for growth in a
financing business. Accordingly, management considers Global
Financing receivables as a profit-generating investment, not as working
capital that should be minimized for efficiency. After considering
Global Financing receivables as an investment, the remaining net
operational cash flow less net capital expenditures is viewed by the
company as free cash flow.
From the perspective of how management views cash flow, in
2011, free cash flow was $16.6 billion, an increase of $0.3 billion
compared to 2010; excluding the impact of higher net income tax
payments driven by audit settlements in 2011, compared to the prior
year, free cash flow would have increased year to year by approximately
$1.1 billion, which approximates the company’s net income growth
for 2011.
Over the past five years, the company generated over $74 billion
in free cash flow. During that period, the company invested over
$16 billion in strategic acquisitions and returned over $81 billion to
shareholders through dividends and share repurchases. The amount
of prospective returns to shareholders in the form of dividends and
share repurchases will vary based upon several factors including
each year’s operating results, capital expenditure requirements,
research and development investments and acquisitions, as well as
the factors discussed below.
The company’s Board of Directors meets quarterly to consider
the dividend payment. In the second quarter of 2011, the Board of
Directors increased the company’s quarterly common stock dividend
from $0.65 to $0.75 per share.