IBM 2011 Annual Report Download - page 103
Download and view the complete annual report
Please find page 103 of the 2011 IBM annual report below. You can navigate through the pages in the report by either clicking on the pages listed below, or by using the keyword search tool below to find specific information within the annual report.-
 1
1 -
2
-
3
-
4
-
5
-
6
-
7
-
8
-
9
-
10
-
11
-
12
-
13
-
14
-
15
-
16
-
17
-
18
-
19
-
20
-
21
-
22
-
23
-
24
-
25
-
26
-
27
-
28
-
29
-
30
-
31
-
32
-
33
-
34
-
35
-
36
-
37
-
38
-
39
-
40
-
41
-
42
-
43
-
44
-
45
-
46
-
47
-
48
-
49
-
50
-
51
-
52
-
53
-
54
-
55
-
56
-
57
-
58
-
59
-
60
-
61
-
62
-
63
-
64
-
65
-
66
-
67
-
68
-
69
-
70
-
71
-
72
-
73
-
74
-
75
-
76
-
77
-
78
-
79
-
80
-
81
-
82
-
83
-
84
-
85
-
86
-
87
-
88
-
89
-
90
-
91
-
92
-
 93
93 -
 94
94 -
 95
95 -
 96
96 -
 97
97 -
 98
98 -
 99
99 -
 100
100 -
 101
101 -
 102
102 -
 103
103 -
 104
104 -
 105
105 -
 106
106 -
 107
107 -
 108
108 -
 109
109 -
 110
110 -
 111
111 -
 112
112 -
 113
113 -
114
-
115
-
116
-
117
-
118
-
119
-
120
-
121
-
122
-
123
-
124
-
125
-
126
-
127
-
128
-
129
-
130
-
131
-
132
-
133
-
134
-
135
-
136
-
137
-
138
-
139
-
140
-
141
-
142
-
143
-
144
-
145
-
146
-
147
-
148
 |
 |

Notes to Consolidated Financial Statements
International Business Machines Corporation and Subsidiary Companies 101
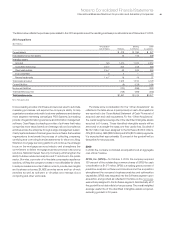
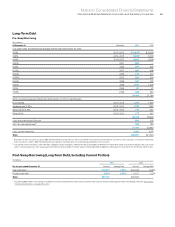
Note F.
Financing Receivables
The following table presents financing receivables, net of allowances
for credit losses, including residual values.
($ in millions)
At December 31: 2011 2010
Current
Net investment in sales-type
and direct financing leases $ 3,765 $ 3,945
Commercial financing receivables 7,095 6,777
Client loan receivables 5,195 4,718
Installment payment receivables 846 816
To t a l $16,901 $16,257
Noncurrent
Net investment in sales-type
and direct financing leases $ 5,406 $ 5,384
Commercial financing receivables 34 43
Client loan receivables 4,925 4,734
Installment payment receivables 410 388
To t a l $10,776 $10,548
Net investment in sales-type and direct financing leases relates
principally to the company’s systems products and are for terms ranging
generally from two to six years. Net investment in sales-type and
direct financing leases includes unguaranteed residual values
of $745 million and $871 million at December 31, 2011 and 2010,
respectively, and is reflected net of unearned income of $733 million
and $816 million, and net of the allowance for credit losses of
$118 million and $126 million at those dates, respectively.
Scheduled maturities of minimum lease payments outstanding
at December 31, 2011, expressed as a percentage of the total, are
approximately: 2012, 44 percent; 2013, 28 percent; 2014, 18 percent;
2015, 7 percent; and 2016 and beyond, 3 percent.
Commercial financing receivables, net of allowance for credit
losses of $53 million and $58 million at December 31, 2011 and 2010,
respectively, relate primarily to inventory and accounts receivable
financing for dealers and remarketers of IBM and non-IBM products.
Payment terms for inventory and accounts receivable financing
generally range from 30 to 90 days.
Client loan receivables, net of allowance for credit losses
of $126 million and $160 million at December 31, 2011 and 2010,
respectively, are loans that are provided by Global Financing primarily
to clients to finance the purchase of software and services. Separate
contractual relationships on these financing arrangements are for
terms ranging generally from one to seven years.
Installment payment receivables, net of allowance for credit
losses of $51 million and $56 million at December 31, 2011 and
2010, respectively, are loans that are provided primarily to clients to
finance hardware, software and services ranging generally from one
to three years.
Client loan receivables and installment payment receivables
financing contracts are priced independently at competitive market
rates. The company has a history of enforcing the terms of these
separate financing agreements.
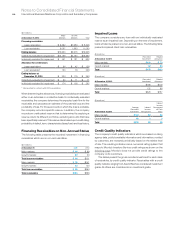
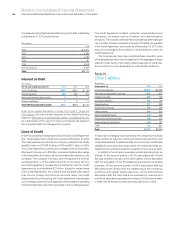
The company utilizes certain of its financing receivables as
collateral for non-recourse borrowings. Financing receivables pledged
as collateral for borrowings were $324 million and $302 million at
December 31, 2011 and 2010, respectively. These borrowings are
included in note J, “Borrowings,” on pages 106 to 108.
The company did not have any financing receivables held for
sale as of December 31, 2011 and 2010.
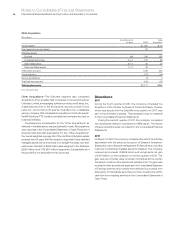
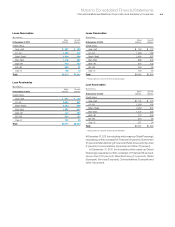
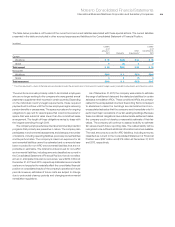
Financing Receivables by Portfolio Segment
The following table presents financing receivables on a gross basis
excluding the allowance for credit losses and residual value, by
portfolio segment and by class, excluding current commercial
financing receivables and other miscellaneous financing receivables.
The company determines its allowance for credit losses based on
two portfolio segments: lease receivables and loan receivables
and further segments the portfolio via two classes: major markets
and growth markets.
($ in millions)
At December 31, 2011:
Major
Markets
Growth
Markets To ta l
Financing receivables
Lease receivables $ 6,510 $1,921 $ 8,430
Loan receivables 9,077 2,552 11,629
Ending balance $15,587 $4,472 $20,060
Collectively evaluated for impairment $15,321 $4,370 $19,692
Individually evaluated for impairment $ 266 $ 102 $ 368
Allowance for credit losses
Beginning balance at
January 1, 2011
Lease receivables $ 84 $ 42 $ 126
Loan receivables 150 76 226
To t a l $ 234 $ 119 $ 353
Write-offs (68) (16) (84)
Provision 39 5 44
Other (1) (4) (5)
Ending balance at
December 31, 2011 $ 203 $ 104 $ 307
Lease receivables $ 79 $ 40 $ 118
Loan receivables $ 125 $ 64 $ 189
Collectively evaluated for impairment $ 82 $ 15 $ 96
Individually evaluated for impairment $ 122 $ 89 $ 211