IBM 2011 Annual Report Download - page 141
Download and view the complete annual report
Please find page 141 of the 2011 IBM annual report below. You can navigate through the pages in the report by either clicking on the pages listed below, or by using the keyword search tool below to find specific information within the annual report.-
 1
1 -
2
-
3
-
4
-
5
-
6
-
7
-
8
-
9
-
10
-
11
-
12
-
13
-
14
-
15
-
16
-
17
-
18
-
19
-
20
-
21
-
22
-
23
-
24
-
25
-
26
-
27
-
28
-
29
-
30
-
31
-
32
-
33
-
34
-
35
-
36
-
37
-
38
-
39
-
40
-
41
-
42
-
43
-
44
-
45
-
46
-
47
-
48
-
49
-
50
-
51
-
52
-
53
-
54
-
55
-
56
-
57
-
58
-
59
-
60
-
61
-
62
-
63
-
64
-
65
-
66
-
67
-
68
-
69
-
70
-
71
-
72
-
73
-
74
-
75
-
76
-
77
-
78
-
79
-
80
-
81
-
82
-
83
-
84
-
85
-
86
-
87
-
88
-
89
-
90
-
91
-
92
-
93
-
94
-
95
-
96
-
97
-
98
-
99
-
100
-
101
-
102
-
103
-
104
-
105
-
106
-
107
-
108
-
109
-
110
-
111
-
112
-
113
-
114
-
115
-
116
-
117
-
118
-
119
-
120
-
121
-
122
-
123
-
124
-
125
-
126
-
127
-
128
-
129
-
130
-
 131
131 -
 132
132 -
 133
133 -
 134
134 -
 135
135 -
 136
136 -
 137
137 -
 138
138 -
 139
139 -
 140
140 -
 141
141 -
 142
142 -
 143
143 -
 144
144 -
 145
145 -
 146
146 -
 147
147 -
 148
148
 |
 |

139
Notes to Consolidated Financial Statements
International Business Machines Corporation and Subsidiary Companies
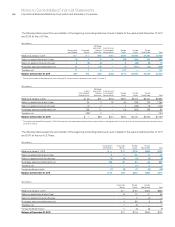
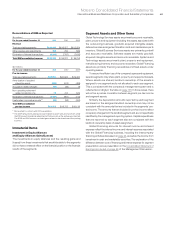
Reconciliations of IBM as Reported
($ in millions)
At December 31: 2011 2010 2009
Assets
Total reportable segments $ 91,557 $ 89,292 $ 81,714
Elimination of internal transactions (5,407) (5,515)(5,481)
Unallocated amounts
Cash and marketable securities 10,575 10,113 12,688
Notes and accounts receivable 3,526 3,762 3,928
Deferred tax assets 4,865 4,494 5,545
Plant, other property
and equipment 2,918 3,067 2,971
Pension assets 2,837 3,060 2,994
Other 5,562 5,178 4,665
Total IBM consolidated assets $116,433 $113,452 $109,022
Major Clients
No single client represented 10 percent or more of the company’s
total revenue in 2011, 2010 or 2009.
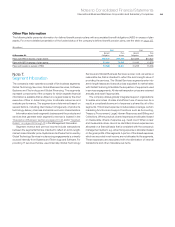
Geographic Information
The following provides information for those countries that are
10 percent or more of the specific category.
Revenue*
($ in millions)
For the year ended December 31: 2011 2010 2009
United States $ 37,041 $35,581 $34,150
Japan 10,968 10,701 10,222
Other countries 58,906 53,589 51,386
Total IBM consolidated revenue $106,916 $99,870 $95,758
* Revenues are attributed to countries based on the location of the client.
Net Plant, Property and Equipment
($ in millions)
At December 31: 2011 2010 2009
United States $ 6,271 $ 6,134 $ 6,313
Other countries 6,186 6,298 6,142
To t a l $12,457 $12,432 $12,455
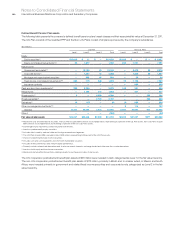
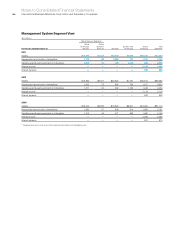
Revenue by Classes of
Similar Products or Services
The following table presents external revenue for similar classes of
products or services within the company’s reportable segments.
Within Global Technology Services and Global Business Services,
client solutions often include IBM software and systems and other
suppliers’ products if the client solution requires it. Within Software,
product license charges and ongoing subscription and support are
reported as Software, and software as a service, consulting,
education, training and other product-related services are reported
as Services. Within Systems and Technology, Microelectronics
original equipment manufacturer (OEM) revenue is primarily from
the sale of semiconductors. Microelectronics Services revenue
includes circuit and component design services and technology
and manufacturing consulting services. See “Description of the
Business,” beginning on page 20 for additional information.
($ in millions)
For the year ended December 31: 2011 2010 2009
Global Technology Services
Services $31,746 $29,367 $28,762
Maintenance 7,515 7,250 6,956
Systems 1,478 1,409 1,279
Software 140 175 351
Global Business Services
Services $18,956 $17,858 $17,213
Software 211 236 231
Systems 118 129 208
Software
Software $22,921 $20,882 $20,094
Services 2,022 1,603 1,302
Systems and Technology
Servers $12,362 $11,619 $10,627
Storage 3,619 3,420 3,177
Microelectronics OEM 1,975 1,938 1,550
Retail Store Solutions 753 674 551
Microelectronics Services 277 321 285
Global Financing
Financing $ 1,612 $ 1,580 $ 1,715
Used equipment sales 490 659 588
Note U.
Subsequent Events
On January 31, 2012, the company announced that the Board of
Directors approved a quarterly dividend of $0.75 per common share.
The dividend is payable March 10, 2012 to shareholders of record
on February 10, 2012.
On February 1, 2012, the company issued $2.5 billion in fixed rate
bonds as follows: $1.5 billion in 3-year bonds with a 0.55 percent
coupon, and $1.0 billion in 5-year bonds with a 1.25 percent coupon.
On February 3, 2012, the company issued C$500 million in
Canadian 5-year fixed rate bonds with a 2.20 percent coupon.