IBM 2011 Annual Report Download - page 36
Download and view the complete annual report
Please find page 36 of the 2011 IBM annual report below. You can navigate through the pages in the report by either clicking on the pages listed below, or by using the keyword search tool below to find specific information within the annual report.-
 1
1 -
2
-
3
-
4
-
5
-
6
-
7
-
8
-
9
-
10
-
11
-
12
-
13
-
14
-
15
-
16
-
17
-
18
-
19
-
20
-
21
-
22
-
23
-
24
-
25
-
 26
26 -
 27
27 -
 28
28 -
 29
29 -
 30
30 -
 31
31 -
 32
32 -
 33
33 -
 34
34 -
 35
35 -
 36
36 -
 37
37 -
 38
38 -
 39
39 -
 40
40 -
 41
41 -
 42
42 -
 43
43 -
 44
44 -
 45
45 -
 46
46 -
47
-
48
-
49
-
50
-
51
-
52
-
53
-
54
-
55
-
56
-
57
-
58
-
59
-
60
-
61
-
62
-
63
-
64
-
65
-
66
-
67
-
68
-
69
-
70
-
71
-
72
-
73
-
74
-
75
-
76
-
77
-
78
-
79
-
80
-
81
-
82
-
83
-
84
-
85
-
86
-
87
-
88
-
89
-
90
-
91
-
92
-
93
-
94
-
95
-
96
-
97
-
98
-
99
-
100
-
101
-
102
-
103
-
104
-
105
-
106
-
107
-
108
-
109
-
110
-
111
-
112
-
113
-
114
-
115
-
116
-
117
-
118
-
119
-
120
-
121
-
122
-
123
-
124
-
125
-
126
-
127
-
128
-
129
-
130
-
131
-
132
-
133
-
134
-
135
-
136
-
137
-
138
-
139
-
140
-
141
-
142
-
143
-
144
-
145
-
146
-
147
-
148
 |
 |

34
Management Discussion
International Business Machines Corporation and Subsidiary Companies
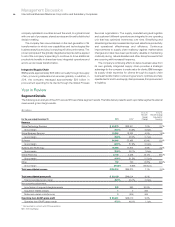
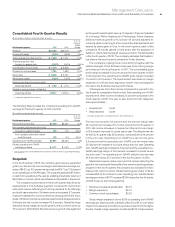
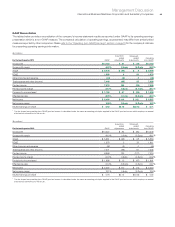
Research, Development and Engineering
($ in millions)
For the year ended December 31: 2011 2010
Yr.-to-Yr.
Percent
Change
Total consolidated research,
development and engineering $6,258 $6,026 3.8%
Non-operating adjustment
Non-operating retirement-related
(costs)/income 88 126 (30.4)
Operating (non-GAAP) research,
development and engineering $6,345 $6,152 3.1%
The company continues to invest in research and development,
focusing its investments on high-value, high-growth opportunities
and to extend its technology leadership. Total research, development
and engineering (RD&E) expense increased 3.8 percent in 2011
versus 2010, primarily driven by acquisitions (up 4 points) and
currency impacts (up 2 points), partially offset by base expense
(down 2 points). Operating (non-GAAP) RD&E expense increased
3.1 percent in 2011 compared to the prior year primarily driven by
the same factors. RD&E investments represented 5.9 percent of
revenue in 2011, compared to 6.0 percent in 2010.
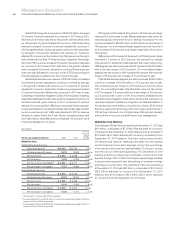
Intellectual Property and Custom Development Income
($ in millions)
For the year ended December 31: 2011 2010
Yr.-to-Yr.
Percent
Change
Sales and other transfers
of intellectual property $ 309 $ 203 52.3%
Licensing/royalty-based fees 211 312 (32.5)
Custom development income 588 638 (8.0)
To t a l $1,108 $1,154 (4.0)%
The timing and amount of sales and other transfers of IP may
vary significantly from period to period depending upon timing
of divestitures, industry consolidation, economic conditions and
the timing of new patents and know-how development. There were
no significant individual IP transactions in 2011 or 2010.
Interest Expense
($ in millions)
For the year ended December 31: 2011 2010
Yr.-to-Yr.
Percent
Change
Interest expense
To t a l $411 $368 11.6%
The increase in interest expense in 2011 versus 2010 was primarily
driven by higher average debt levels, partially offset by lower average
interest rates. Interest expense is presented in cost of financing in
the Consolidated State ment of Earnings only if the related external
borrowings are to support the Global Financing external business.
See pages 66 and 67 for additional information regarding Global
Financing debt and interest expense. Overall interest expense
(excluding capitalized interest) for 2011 was $964 million, an
increase of $41 million year to year.
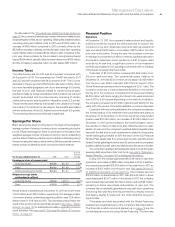
Stock-Based Compensation
Total pre-tax stock-based compensation cost of $697 million
increased $68 million compared to 2010. The increase was primarily
the result of an increase related to the company’s assumption of stock-
based awards previously issued by acquired entities ($22 million)
and increases related to restricted stock units and performance share
units ($48 million), partially offset by a reduction related to stock
options ($2 million). Cost, and the year-to-year change, was reflected
in the following categories: Cost: $120 million, up $27 million; SG&A
expense: $514 million, up $26 million; and RD&E expense: $62 million,
up $14 million.
See note R, “Stock-Based Compensation,” on pages 118 to 121
for additional information on stock-based incentive awards.
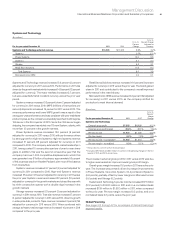
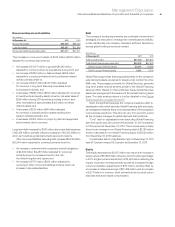
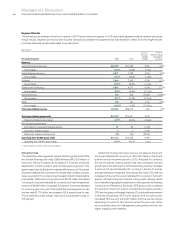
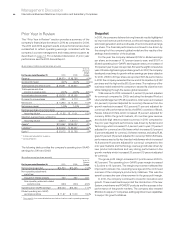
Retirement-Related Plans
The following table provides the total pre-tax cost for all retirement-
related plans. These amounts are included in the Consolidated
Statement of Earnings within the caption (e.g., Cost, SG&A, RD&E)
relating to the job function of the plan participants.
($ in millions)
For the year ended December 31: 2011 2010
Yr.-to-Yr.
Percent
Change
Retirement-related plans—cost
Service cost $ 549 $ 550 (0.2)%
Amortization of prior
service cost/(credits) (157)(183)(14.6)
Cost of defined contribution plans 1,513 1,430 5.8
Total operating costs $ 1,905 $ 1,796 6.0%
Interest cost 4,601 4,763 (3.4)
Expected return on plan assets (6,574)(6,488) 1.3
Recognized actuarial losses 1,788 1,194 49.7
Plan amendments/curtailments/
settlements 127 (98.0)
Multi-employer plan/other costs 112 89 26.0
Total non-operating costs/
(income) $ (72) $ (414) (82.5)%
Total retirement-related
plans—cost $ 1,832 $ 1,382 32.6%
In 2011, total retirement-related plans cost increased by $450 million
compared to 2010, primarily driven by an increase in recognized
actuarial losses of $594 million and increased cost associated with
defined contribution plans ($83 million), partially offset by lower
interest cost of $162 million and an increased expected return on
plan assets of $87 million.