IBM 2011 Annual Report Download - page 140
Download and view the complete annual report
Please find page 140 of the 2011 IBM annual report below. You can navigate through the pages in the report by either clicking on the pages listed below, or by using the keyword search tool below to find specific information within the annual report.-
 1
1 -
2
-
3
-
4
-
5
-
6
-
7
-
8
-
9
-
10
-
11
-
12
-
13
-
14
-
15
-
16
-
17
-
18
-
19
-
20
-
21
-
22
-
23
-
24
-
25
-
26
-
27
-
28
-
29
-
30
-
31
-
32
-
33
-
34
-
35
-
36
-
37
-
38
-
39
-
40
-
41
-
42
-
43
-
44
-
45
-
46
-
47
-
48
-
49
-
50
-
51
-
52
-
53
-
54
-
55
-
56
-
57
-
58
-
59
-
60
-
61
-
62
-
63
-
64
-
65
-
66
-
67
-
68
-
69
-
70
-
71
-
72
-
73
-
74
-
75
-
76
-
77
-
78
-
79
-
80
-
81
-
82
-
83
-
84
-
85
-
86
-
87
-
88
-
89
-
90
-
91
-
92
-
93
-
94
-
95
-
96
-
97
-
98
-
99
-
100
-
101
-
102
-
103
-
104
-
105
-
106
-
107
-
108
-
109
-
110
-
111
-
112
-
113
-
114
-
115
-
116
-
117
-
118
-
119
-
120
-
121
-
122
-
123
-
124
-
125
-
126
-
127
-
128
-
129
-
 130
130 -
 131
131 -
 132
132 -
 133
133 -
 134
134 -
 135
135 -
 136
136 -
 137
137 -
 138
138 -
 139
139 -
 140
140 -
 141
141 -
 142
142 -
 143
143 -
 144
144 -
 145
145 -
 146
146 -
 147
147 -
 148
148
 |
 |
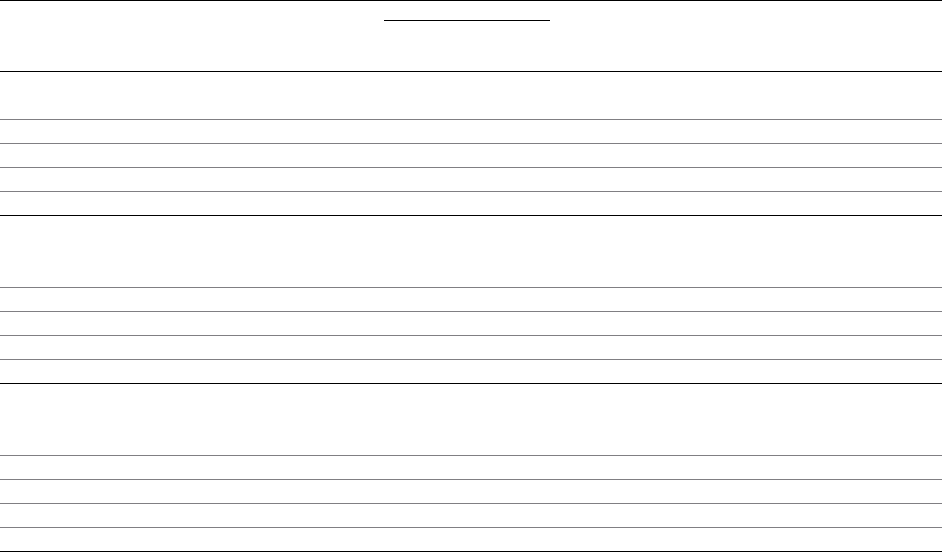
Notes to Consolidated Financial Statements
International Business Machines Corporation and Subsidiary Companies138
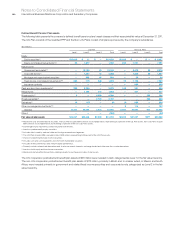
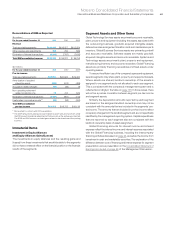
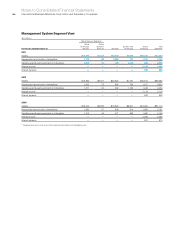
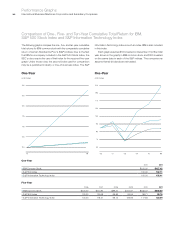
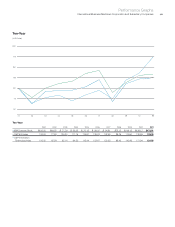
Management System Segment View
($ in millions)
Global Services Segments
For the year ended December 31:
Global
Technology
Services
Global
Business
Services Software
Systems and
Technology
Global
Financing
Tot a l
Segments
2011
Assets $15,475 $8,078 $23,926 $7,649 $36,427 $91,557
Depreciation/amortization of intangibles* 1,713 83 1,062 737 1,145 4,739
Capital expenditures/investments in intangibles 1,838 56 469 1,032 930 4,325
Interest income — — — — 2,139 2,139
Interest expense — — — — 538 538
2010
Assets $15,560 $8,007 $22,625 $7,287 $35,813 $89,292
Depreciation/amortization of intangibles* 1,632 75 992 784 1,417 4,900
Capital expenditures/investments in intangibles 1,511 52 463 1,163 1,246 4,434
Interest income — — — — 2,116 2,116
Interest expense — — — — 548 548
2009
Assets $16,422 $6,885 $16,894 $6,907 $34,605 $81,714
Depreciation/amortization of intangibles* 1,680 87 906 814 1,694 5,181
Capital expenditures/investments in intangibles 1,512 45 471 658 1,460 4,145
Interest income — — — — 2,265 2,265
Interest expense — — — — 674 674
* Segment pre-tax income does not include the amortization of intangible assets.