IBM 2011 Annual Report Download - page 105
Download and view the complete annual report
Please find page 105 of the 2011 IBM annual report below. You can navigate through the pages in the report by either clicking on the pages listed below, or by using the keyword search tool below to find specific information within the annual report.-
 1
1 -
2
-
3
-
4
-
5
-
6
-
7
-
8
-
9
-
10
-
11
-
12
-
13
-
14
-
15
-
16
-
17
-
18
-
19
-
20
-
21
-
22
-
23
-
24
-
25
-
26
-
27
-
28
-
29
-
30
-
31
-
32
-
33
-
34
-
35
-
36
-
37
-
38
-
39
-
40
-
41
-
42
-
43
-
44
-
45
-
46
-
47
-
48
-
49
-
50
-
51
-
52
-
53
-
54
-
55
-
56
-
57
-
58
-
59
-
60
-
61
-
62
-
63
-
64
-
65
-
66
-
67
-
68
-
69
-
70
-
71
-
72
-
73
-
74
-
75
-
76
-
77
-
78
-
79
-
80
-
81
-
82
-
83
-
84
-
85
-
86
-
87
-
88
-
89
-
90
-
91
-
92
-
93
-
94
-
 95
95 -
 96
96 -
 97
97 -
 98
98 -
 99
99 -
 100
100 -
 101
101 -
 102
102 -
 103
103 -
 104
104 -
 105
105 -
 106
106 -
 107
107 -
 108
108 -
 109
109 -
 110
110 -
 111
111 -
 112
112 -
 113
113 -
 114
114 -
 115
115 -
116
-
117
-
118
-
119
-
120
-
121
-
122
-
123
-
124
-
125
-
126
-
127
-
128
-
129
-
130
-
131
-
132
-
133
-
134
-
135
-
136
-
137
-
138
-
139
-
140
-
141
-
142
-
143
-
144
-
145
-
146
-
147
-
148
 |
 |

Notes to Consolidated Financial Statements
International Business Machines Corporation and Subsidiary Companies 103
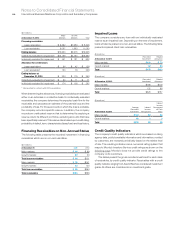
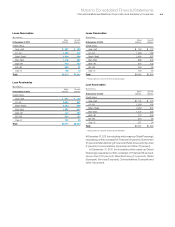
Lease Receivables
($ in millions)
At December 31, 2011:
Major
Markets
Growth
Markets
Credit rating
Aaa – Aa3 $ 697 $ 139
A1 – A3 1,459 306
Baa1 – Baa3 2,334 654
Ba1 – Ba2 1,118 457
Ba3 – B1 534 252
B2 – B3 260 97
Caa – D 108 15
To t a l $6,510 $1,921
Loan Receivables
($ in millions)
At December 31, 2011:
Major
Markets
Growth
Markets
Credit rating
Aaa – Aa3 $ 971 $ 185
A1 – A3 2,034 407
Baa1 – Baa3 3,255 869
Ba1 – Ba2 1,559 607
Ba3 – B1 744 335
B2 – B3 362 129
Caa – D 151 20
To t a l $9,077 $2,552
Lease Receivables*
($ in millions)
At December 31, 2010:
Major
Markets
Growth
Markets
Credit rating
Aaa – Aa3 $ 794 $ 173
A1 – A3 1,463 182
Baa1 – Baa3 2,494 837
Ba1 – Ba2 899 403
Ba3 – B1 518 242
B2 – B3 230 93
Caa – D 164 54
To t a l $6,562 $1,983
* Reclassified to conform with 2011 presentation.
Loan Receivables*
($ in millions)
At December 31, 2010:
Major
Markets
Growth
Markets
Credit rating
Aaa – Aa3 $1,100 $ 173
A1 – A3 2,026 183
Baa1 – Baa3 3,453 841
Ba1 – Ba2 1,245 405
Ba3 – B1 718 243
B2 – B3 318 94
Caa – D 227 54
To t a l $9,087 $1,993
* Reclassified to conform with 2011 presentation.
At December 31, 2011, the industries which made up Global Financing’s
receivables portfolio consisted of: Financial (39 percent), Government
(15 percent), Manufacturing (13 percent), Retail (9 percent), Services
(7 percent), Communications (6 percent) and Other (11 percent).
At December 31, 2010, the industries which made up Global
Financing’s receivables portfolio consisted of: Financial (36 percent),
Government (16 percent), Manufacturing (14 percent), Retail
(9 percent), Services (8 percent), Communications (5 percent) and
Other (12 percent).