IBM 2011 Annual Report Download - page 95
Download and view the complete annual report
Please find page 95 of the 2011 IBM annual report below. You can navigate through the pages in the report by either clicking on the pages listed below, or by using the keyword search tool below to find specific information within the annual report.-
 1
1 -
2
-
3
-
4
-
5
-
6
-
7
-
8
-
9
-
10
-
11
-
12
-
13
-
14
-
15
-
16
-
17
-
18
-
19
-
20
-
21
-
22
-
23
-
24
-
25
-
26
-
27
-
28
-
29
-
30
-
31
-
32
-
33
-
34
-
35
-
36
-
37
-
38
-
39
-
40
-
41
-
42
-
43
-
44
-
45
-
46
-
47
-
48
-
49
-
50
-
51
-
52
-
53
-
54
-
55
-
56
-
57
-
58
-
59
-
60
-
61
-
62
-
63
-
64
-
65
-
66
-
67
-
68
-
69
-
70
-
71
-
72
-
73
-
74
-
75
-
76
-
77
-
78
-
79
-
80
-
81
-
82
-
83
-
84
-
 85
85 -
 86
86 -
 87
87 -
 88
88 -
 89
89 -
 90
90 -
 91
91 -
 92
92 -
 93
93 -
 94
94 -
 95
95 -
 96
96 -
 97
97 -
 98
98 -
 99
99 -
 100
100 -
 101
101 -
 102
102 -
 103
103 -
 104
104 -
 105
105 -
106
-
107
-
108
-
109
-
110
-
111
-
112
-
113
-
114
-
115
-
116
-
117
-
118
-
119
-
120
-
121
-
122
-
123
-
124
-
125
-
126
-
127
-
128
-
129
-
130
-
131
-
132
-
133
-
134
-
135
-
136
-
137
-
138
-
139
-
140
-
141
-
142
-
143
-
144
-
145
-
146
-
147
-
148
 |
 |

Notes to Consolidated Financial Statements
International Business Machines Corporation and Subsidiary Companies 93
2009
On October 1, 2009, the company completed the divestiture of its
UniData and UniVerse software products and related tools to Rocket
Software, a privately held global software development firm. The
company recognized gains related to this transaction in the fourth
quarter of 2009 and in the fourth quarter of 2010.
On March 16, 2009, the company completed the sale of certain
processes, resources, assets and third-party contracts related to
its core logistics operations to Geodis. The company received
proceeds of $365 million and recognized a net gain of $298 million
on the transaction in the first quarter of 2009. The gain was net of
the fair value of certain contractual terms, certain transaction costs
and related real estate charges. As part of this transaction, the
company outsourced its logistics operations to Geodis which enables
the company to leverage industry-leading skills and scale and
improve the productivity of the company’s supply chain.
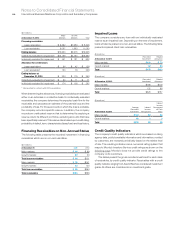
Note D.
Financial Instruments
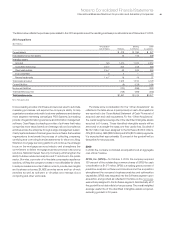
Fair Value Measurements
Financial Assets and Liabilities Measured at Fair Value on a Recurring Basis
The following tables present the company’s financial assets and financial liabilities that are measured at fair value on a recurring basis at
December 31, 2011 and 2010.
($ in millions)
At December 31, 2011: Level 1 Level 2 Level 3 To t a l
Assets
Cash equivalents (1)
Time deposits and certificates of deposit $ — $2,082 $— $2,082
Commercial paper — 1,760 — 1,760
Money market funds 1,886 — — 1,886
U.S. government securities — 2,750 — 2,750
Other securities — 8 — 8
To ta l 1,886 6,600 — 8,486(5)
Debt securities—noncurrent (2) 1 7 — 8
Available-for-sale equity investments (2) 69 14 — 83
Derivative assets (3)
Interest rate contracts — 783 — 783
Foreign exchange contracts — 510 — 510
Equity contracts — 7 — 7
To ta l — 1,300 — 1,300 (6)
Total assets $1,956 $7,921 $— $9,877 (6)
Liabilities
Derivative liabilities (4)
Foreign exchange contracts $ — $ 523 $— $ 523
Equity contracts — 8 — 8
Total liabilities $ — $ 531 $— $ 531 (6)
(1) Included within cash and cash equivalents in the Consolidated Statement of Financial Position.
(2) Included within investments and sundry assets in the Consolidated Statement of Financial Position.
(3)
The gross balances of derivative assets contained within prepaid expenses and other current assets, and investments in sundry assets in the Consolidated Statement of Financial
Position at December 31, 2011 are $546 million and $754 million, respectively.
(4)
The gross balances of derivative liabilities contained within other accrued expenses and liabilities, and other liabilities in the Consolidated Statement of Financial Position
at December 31, 2011 are $365 million and $166 million, respectively.
(5) Available-for-sale securities with carrying values that approximate fair value.
(6)
If derivative exposures covered by a qualifying master netting agreement had been netted in the Consolidated Statement of Financial Position, the total derivative asset and
liability positions would have been reduced by $324 million each.