IBM 2011 Annual Report Download - page 101
Download and view the complete annual report
Please find page 101 of the 2011 IBM annual report below. You can navigate through the pages in the report by either clicking on the pages listed below, or by using the keyword search tool below to find specific information within the annual report.-
 1
1 -
2
-
3
-
4
-
5
-
6
-
7
-
8
-
9
-
10
-
11
-
12
-
13
-
14
-
15
-
16
-
17
-
18
-
19
-
20
-
21
-
22
-
23
-
24
-
25
-
26
-
27
-
28
-
29
-
30
-
31
-
32
-
33
-
34
-
35
-
36
-
37
-
38
-
39
-
40
-
41
-
42
-
43
-
44
-
45
-
46
-
47
-
48
-
49
-
50
-
51
-
52
-
53
-
54
-
55
-
56
-
57
-
58
-
59
-
60
-
61
-
62
-
63
-
64
-
65
-
66
-
67
-
68
-
69
-
70
-
71
-
72
-
73
-
74
-
75
-
76
-
77
-
78
-
79
-
80
-
81
-
82
-
83
-
84
-
85
-
86
-
87
-
88
-
89
-
90
-
 91
91 -
 92
92 -
 93
93 -
 94
94 -
 95
95 -
 96
96 -
 97
97 -
 98
98 -
 99
99 -
 100
100 -
 101
101 -
 102
102 -
 103
103 -
 104
104 -
 105
105 -
 106
106 -
 107
107 -
 108
108 -
 109
109 -
 110
110 -
 111
111 -
112
-
113
-
114
-
115
-
116
-
117
-
118
-
119
-
120
-
121
-
122
-
123
-
124
-
125
-
126
-
127
-
128
-
129
-
130
-
131
-
132
-
133
-
134
-
135
-
136
-
137
-
138
-
139
-
140
-
141
-
142
-
143
-
144
-
145
-
146
-
147
-
148
 |
 |

Notes to Consolidated Financial Statements
International Business Machines Corporation and Subsidiary Companies 99
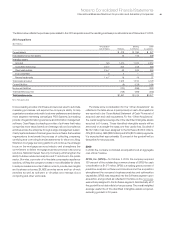
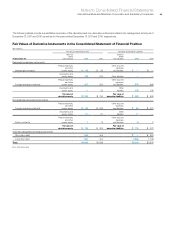
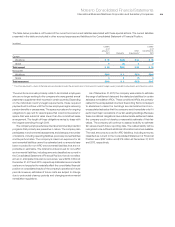
The following tables provide a quantitative summary of the derivative and non-derivative instrument related risk management activity as of
December 31, 2011 and 2010 as well as for the years ended December 31, 2011 and 2010, respectively.
Fair Values of Derivative Instruments in the Consolidated Statement of Financial Position
($ in millions)
Fair Value of Derivative Assets Fair Value of Derivative Liabilities
At December 31:
Balance
Sheet
Classification 2011 2010
Balance
Sheet
Classification 2011 2010
Designated as hedging instruments
Interest rate contracts
Prepaid expenses
and other
current assets $ 50 $ 33
Other accrued
expenses
and liabilities $ — $ —
Investments and
sundry assets 733 514 Other liabilities ——
Foreign exchange contracts
Prepaid expenses
and other
current assets 407 224
Other accrued
expenses
and liabilities 273 498
Investments and
sundry assets —22
Other
liabilities 155 135
Fair value of
derivative assets $1,190 $ 794
Fair value of
derivative liabilities $ 428 $ 633
Not designated as hedging instruments
Foreign exchange contracts
Prepaid expenses
and other
current assets $ 82 $ 242
Other accrued
expenses
and liabilities $ 84 $ 370
Investments and
sundry assets 21 51
Other
liabilities 11 —
Equity contracts
Prepaid expenses
and other
current assets 712
Other accrued
expenses
and liabilities 83
Fair value of
derivative assets $ 110 $ 305
Fair value of
derivative liabilities $ 103 $ 373
Total debt designated as hedging instruments
Short-term debt N/A N/A $ — $ 823
Long-term debt N/A N/A 1,884 1,746
To t a l $1,300 $1,099 $2,415 $3,576
N/A—Not applicable