IBM 2011 Annual Report Download - page 21
Download and view the complete annual report
Please find page 21 of the 2011 IBM annual report below. You can navigate through the pages in the report by either clicking on the pages listed below, or by using the keyword search tool below to find specific information within the annual report.-
 1
1 -
2
-
3
-
4
-
5
-
6
-
7
-
8
-
9
-
10
-
 11
11 -
 12
12 -
 13
13 -
 14
14 -
 15
15 -
 16
16 -
 17
17 -
 18
18 -
 19
19 -
 20
20 -
 21
21 -
 22
22 -
 23
23 -
 24
24 -
 25
25 -
 26
26 -
 27
27 -
 28
28 -
 29
29 -
 30
30 -
 31
31 -
32
-
33
-
34
-
35
-
36
-
37
-
38
-
39
-
40
-
41
-
42
-
43
-
44
-
45
-
46
-
47
-
48
-
49
-
50
-
51
-
52
-
53
-
54
-
55
-
56
-
57
-
58
-
59
-
60
-
61
-
62
-
63
-
64
-
65
-
66
-
67
-
68
-
69
-
70
-
71
-
72
-
73
-
74
-
75
-
76
-
77
-
78
-
79
-
80
-
81
-
82
-
83
-
84
-
85
-
86
-
87
-
88
-
89
-
90
-
91
-
92
-
93
-
94
-
95
-
96
-
97
-
98
-
99
-
100
-
101
-
102
-
103
-
104
-
105
-
106
-
107
-
108
-
109
-
110
-
111
-
112
-
113
-
114
-
115
-
116
-
117
-
118
-
119
-
120
-
121
-
122
-
123
-
124
-
125
-
126
-
127
-
128
-
129
-
130
-
131
-
132
-
133
-
134
-
135
-
136
-
137
-
138
-
139
-
140
-
141
-
142
-
143
-
144
-
145
-
146
-
147
-
148
 |
 |

19
Management Discussion
International Business Machines Corporation and Subsidiary Companies
statements. Forward-looking statements are based on the company’s
current assumptions regarding future business and financial
performance; these statements by their nature address matters that
are uncertain to different degrees. Forward-looking statements
involve a number of risks, uncertainties and other factors that could
cause actual results to be materially different, as discussed more
fully elsewhere in this Annual Report and in the company’s filings
with the Securities and Exchange Commission (SEC), including the
company’s 2011 Form 10-K filed on February 28, 2012.
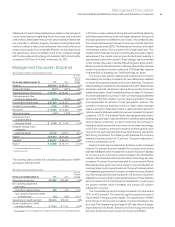
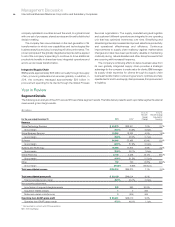
Management Discussion Snapshot
($ and shares in millions except per share amounts)
For the year ended December 31: 2011 2010
Yr.-to-Yr.
Percent/
Margin
Change
Revenue $106,916 $ 99,870 7.1%*
Gross profit margin 46.9% 46.1% 0.8 pts.
Total expense and other income $ 29,135 $ 26,291 10.8%
Total expense and other
income-to-revenue ratio 27.3% 26.3% 0.9 pts.
Income before income taxes $ 21,003 $ 19,723 6.5%
Provision for income taxes 5,148 4,890 5.3%
Net income $ 15,855 $ 14,833 6.9%
Net income margin 14.8% 14.9% 0.0 pts.
Earnings per share
of common stock
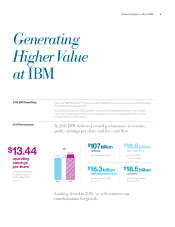
Assuming dilution $ 13.06 $ 11.52 13.4%
Weighted-average shares
outstanding
Assuming dilution 1,213.8 1,287.4 (5.7)%
Assets** $116,433 $113,452 2.6%
Liabilities** $ 96,197 $ 90,279 6.6%
Equity** $ 20,236 $ 23,172 (12.7)%
* 3.4 percent adjusted for currency.
** At December 31.
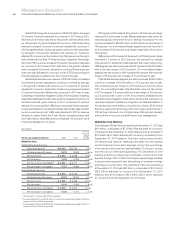
The following table provides the company’s operating (non-GAAP)
earnings for 2011 and 2010.
($ in millions except per share amounts)
For the year ended December 31: 2011 2010
Yr.-to-Yr.
Percent
Change
Net income as reported $15,855 $14,833 6.9%
Non-operating adjustments
(net of tax)
Acquisition-related charges 495 443 12.0
Non-operating retirement-related
costs/(income) (32) (253)(87.3)
Operating (non-GAAP) earnings* $16,318 $15,023 8.6%
Diluted operating (non-GAAP)
earnings per share $ 13.44 $ 11.67 15.2%
*
See page 38 for a more detailed reconciliation of net income to operating earnings.
In 2011, the company delivered strong financial results highlighted by
solid revenue performance, continued margin expansion, strong profit
and cash generation and effective use of cash. In its centennial year,
the company achieved record levels of revenue, profit, free cash flow
and earnings per share (EPS). The financial performance is the result
of the transformation of the company which began years ago. This
transformation has been focused on shifting the business to higher
value areas of the market, improving productivity and investing in
opportunities to drive future growth. These changes have contributed
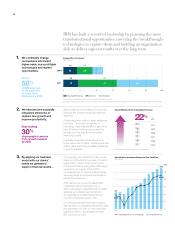
to nine consecutive years of double-digit earnings per share growth.
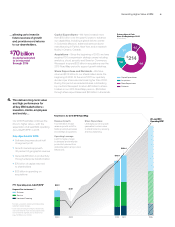
More importantly, this transformation has strengthened the business
and put the company on track to achieve its 2015 Road Map objective
of at least $20 of operating (non-GAAP) earnings per share.
The focus on key growth initiatives and investments in innovation
are enabling the company to expand into new markets and capitalize
on trends like business analytics and cloud computing. The growth
markets strategy to expand into new markets, build out IT infrastructures
and lead in specific industries is driving strong performance and
market share gains. Growth markets revenue increased 16.0 percent
(11 percent adjusted for currency) in 2011 contributing approximately
two-thirds of the total constant currency revenue growth for the year
and represented 22 percent of total geographic revenue. The
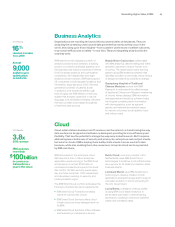
company’s business analytics solutions helps clients leverage
massive amounts of data and content to gain business insight and
optimize results. Business analytics revenue increased 16 percent
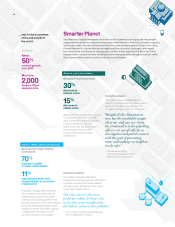
compared to 2010. The Smarter Planet offerings generated close to
50 percent growth year to year, with Smarter Commerce demonstrating
strong market momentum. In cloud computing, the company is
helping its clients improve the economics of information technology.
In 2011, the company continued to expand its offerings and cloud
revenue for the year was more than three times the prior year results.
With strong contribution from these growth initiatives, the company
delivered revenue growth of 7.1 percent (3 percent adjusted for
currency) compared to 2010.
Segment performance was led by Software which increased
revenue 10.9 percent (8 percent adjusted for currency) driven by key
branded middleware which increased 15.6 percent (13 percent adjusted
for currency) and continued to extend its lead in the middleware
market. In the Global Services business, Global Technology Services
increased 7.0 percent (3 percent adjusted for currency) and Global
Business Services grew revenue 5.8 percent (1 percent adjusted for
currency) driven by strong performance in the growth markets where
both segments grew revenue 11 percent at constant currency. Systems
and Technology delivered revenue growth of 5.6 percent (3 percent
adjusted for currency) driven by strong performance in Power Systems
which increased 12.0 percent (9 percent adjusted for currency) and
the growth markets which increased 14.9 percent (12 percent
adjusted for currency).
The consolidated gross profit margin increased 0.8 points versus
2010 to 46.9 percent. This was the eighth consecutive year of
improvement in the gross profit margin. The operating (non-GAAP)
gross margin of 47.2 percent increased 1.1 points compared to the
prior year. The increase in gross margin in 2011 was driven by margin
improvements in Software, Systems and Technology and Global
Services, and an improved revenue mix driven by Software.