IBM 2011 Annual Report Download - page 143
Download and view the complete annual report
Please find page 143 of the 2011 IBM annual report below. You can navigate through the pages in the report by either clicking on the pages listed below, or by using the keyword search tool below to find specific information within the annual report.-
 1
1 -
2
-
3
-
4
-
5
-
6
-
7
-
8
-
9
-
10
-
11
-
12
-
13
-
14
-
15
-
16
-
17
-
18
-
19
-
20
-
21
-
22
-
23
-
24
-
25
-
26
-
27
-
28
-
29
-
30
-
31
-
32
-
33
-
34
-
35
-
36
-
37
-
38
-
39
-
40
-
41
-
42
-
43
-
44
-
45
-
46
-
47
-
48
-
49
-
50
-
51
-
52
-
53
-
54
-
55
-
56
-
57
-
58
-
59
-
60
-
61
-
62
-
63
-
64
-
65
-
66
-
67
-
68
-
69
-
70
-
71
-
72
-
73
-
74
-
75
-
76
-
77
-
78
-
79
-
80
-
81
-
82
-
83
-
84
-
85
-
86
-
87
-
88
-
89
-
90
-
91
-
92
-
93
-
94
-
95
-
96
-
97
-
98
-
99
-
100
-
101
-
102
-
103
-
104
-
105
-
106
-
107
-
108
-
109
-
110
-
111
-
112
-
113
-
114
-
115
-
116
-
117
-
118
-
119
-
120
-
121
-
122
-
123
-
124
-
125
-
126
-
127
-
128
-
129
-
130
-
131
-
132
-
 133
133 -
 134
134 -
 135
135 -
 136
136 -
 137
137 -
 138
138 -
 139
139 -
 140
140 -
 141
141 -
 142
142 -
 143
143 -
 144
144 -
 145
145 -
 146
146 -
 147
147 -
 148
148
 |
 |

141
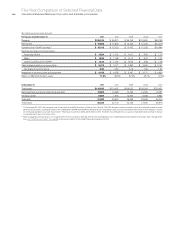
Selected Quarterly Data
International Business Machines Corporation and Subsidiary Companies
($ in millions except per share amounts and stock prices)
2011
First
Quarter
Second
Quarter
Third
Quarter
Fourth
Quarter
Full
Ye a r
Revenue $24,607 $26,666 $26,157 $29,486 $106,916
Gross profit $10,858 $12,385 $12,173 $14,722 $ 50,138
Net income $ 2,863 $ 3,664 $ 3,839 $ 5,490 $ 15,855
Operating (non-GAAP) earnings* $ 2,990 $ 3,777 $ 3,954 $ 5,597 $ 16,318
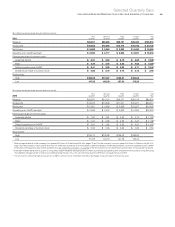
Earnings per share of common stock
Assuming dilution $ 2.31 $ 3.00 $ 3.19 $ 4.62 $ 13.06**
Basic $ 2.34 $ 3.04 $ 3.23 $ 4.68 $ 13.25**
Diluted operating (non-GAAP)* $ 2.41 $ 3.09 $ 3.28 $ 4.71 $ 13.44**
Dividends per share of common stock $ 0.65 $ 0.75 $ 0.75 $ 0.75 $ 2.90
Stock prices+
High $166.05 $172.87 $185.21 $194.56
Low 147.05 162.33 157.54 173.29
($ in millions except per share amounts and stock prices)
2010
First
Quarter
Second
Quarter
Third
Quarter
Fourth
Quarter
Full
Ye a r
Revenue $22,857 $23,724 $24,271 $29,019 $99,870
Gross profit $ 9,976 $10,809 $11,001 $14,227 $46,014
Net income $ 2,601 $ 3,386 $ 3,589 $ 5,257 $14,833
Operating (non-GAAP) earnings* $ 2,638 $ 3,402 $ 3,628 $ 5,354 $15,023
Earnings per share of common stock
Assuming dilution $ 1.97 $ 2.61 $ 2.82 $ 4.18 $ 11.52**
Basic $ 2.00 $ 2.65 $ 2.86 $ 4.24 $ 11.69**
Diluted operating (non-GAAP)* $ 2.00 $ 2.62 $ 2.85 $ 4.25 $ 11.67**
Dividends per share of common stock $ 0.55 $ 0.65 $ 0.65 $ 0.65 $ 2.50
Stock prices+
High $134.14 $132.68 $135.48 $146.92
Low 121.88 122.10 121.86 135.25
*
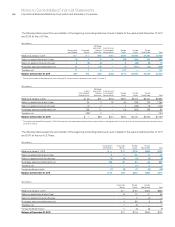
Refer to pages 61 and 62 of the company’s first-quarter 2011 Form 10-Q filed on April 26, 2011, pages 72 and 73 of the company’s second-quarter 2011 Form 10-Q filed on July 26, 2011,
page 73 of the company’s third-quarter 2011 Form 10-Q filed on October 25, 2011 and page 43 under the heading “GAAP Reconciliation,” for the reconciliation of non-GAAP
information for the quarterly data for 2011 and 2010. Also see “GAAP Reconciliation,” on page 38 for the reconciliation of non-GAAP financial information for full-year 2011 and 2010.
**
Earnings Per Share (EPS) in each quarter is computed using the weighted-average number of shares outstanding during that quarter while EPS for the full year is computed using
the weighted-average number of shares outstanding during the year. Thus, the sum of the four quarters’ EPS does not equal the full-year EPS.
+ The stock prices reflect the high and low prices for IBM’s common stock on the New York Stock Exchange composite tape for the last two years.