IBM 2011 Annual Report Download - page 41
Download and view the complete annual report
Please find page 41 of the 2011 IBM annual report below. You can navigate through the pages in the report by either clicking on the pages listed below, or by using the keyword search tool below to find specific information within the annual report.-
 1
1 -
2
-
3
-
4
-
5
-
6
-
7
-
8
-
9
-
10
-
11
-
12
-
13
-
14
-
15
-
16
-
17
-
18
-
19
-
20
-
21
-
22
-
23
-
24
-
25
-
26
-
27
-
28
-
29
-
30
-
 31
31 -
 32
32 -
 33
33 -
 34
34 -
 35
35 -
 36
36 -
 37
37 -
 38
38 -
 39
39 -
 40
40 -
 41
41 -
 42
42 -
 43
43 -
 44
44 -
 45
45 -
 46
46 -
 47
47 -
 48
48 -
 49
49 -
 50
50 -
 51
51 -
52
-
53
-
54
-
55
-
56
-
57
-
58
-
59
-
60
-
61
-
62
-
63
-
64
-
65
-
66
-
67
-
68
-
69
-
70
-
71
-
72
-
73
-
74
-
75
-
76
-
77
-
78
-
79
-
80
-
81
-
82
-
83
-
84
-
85
-
86
-
87
-
88
-
89
-
90
-
91
-
92
-
93
-
94
-
95
-
96
-
97
-
98
-
99
-
100
-
101
-
102
-
103
-
104
-
105
-
106
-
107
-
108
-
109
-
110
-
111
-
112
-
113
-
114
-
115
-
116
-
117
-
118
-
119
-
120
-
121
-
122
-
123
-
124
-
125
-
126
-
127
-
128
-
129
-
130
-
131
-
132
-
133
-
134
-
135
-
136
-
137
-
138
-
139
-
140
-
141
-
142
-
143
-
144
-
145
-
146
-
147
-
148
 |
 |

39
Management Discussion
International Business Machines Corporation and Subsidiary Companies
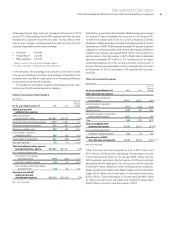
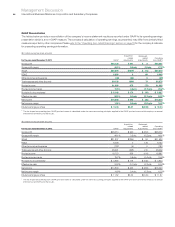
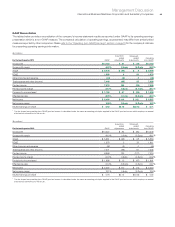
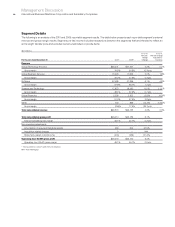
Consolidated Fourth-Quarter Results
($ and shares in millions except per share amounts)
For the fourth quarter: 2011 2010
Yr.-to-Yr.
Percent/
Margin
Change
Revenue $29,486 $29,019 1.6%*
Gross profit margin 49.9% 49.0% 0.9 pts.
Total expense and other income $ 7,448 $ 7,271 2.4%
Total expense and other
income-to-revenue ratio 25.3% 25.1% 0.2 pts.
Income before income taxes $ 7,274 $ 6,956 4.6%
Provision for income taxes 1,784 1,698 5.1%
Net income $ 5,490 $ 5,257 4.4%
Net income margin 18.6% 18.1%0.5 pts.
Earnings per share of common stock
Assuming dilution $ 4.62 $ 4.18 10.5%
Weighted-average shares outstanding
Assuming dilution 1,188.7 1,258.4 (5.5)%
* 1.4 percent adjusted for currency.
The following table provides the company’s operating (non-GAAP)
earnings for the fourth quarter of 2011 and 2010.
($ in millions except per share amounts)
For the fourth quarter: 2011 2010
Yr.-to-Yr.
Percent
Change
Net income as reported $5,490 $5,257 4.4%
Non-operating adjustments (net of tax)
Acquisition-related charges 119 170 (30.0)
Non-operating retirement-related
costs/(income) (12) (74)(84.0)
Operating (non-GAAP) earnings* $5,597 $ 5,354 4.5%
Diluted operating (non-GAAP)
earnings per share $ 4.71 $ 4.25 10.8%
*
See page 43 for a more detailed reconciliation of net income to operating earnings.
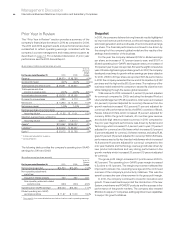
Snapshot
In the fourth quarter of 2011, the company grew revenue, expanded
gross, pre-tax and net income margins and delivered earnings per
share of $4.62, up 10.5 percent as reported, and $4.71, up 10.8 percent
on an operating (non-GAAP) basis. The company generated $7.1 billion
in cash from operations in the quarter enabling shareholder returns of
$4.5 billion in common stock repurchases and dividends in the period.
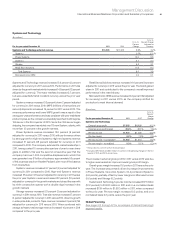
The company’s performance in the fourth quarter was driven by
several factors. The Software segment continued its momentum
with performance reflecting both strong demand for its offerings
and solid sales execution. Software revenue increased 8.7 percent
(9 percent adjusted for currency) driven by strong growth in the focus
areas of Smarter Commerce, business analytics and storage solutions.
Software pre-tax income increased 12.5 percent. Global Services
delivered strong margin and profit growth, with pre-tax income up
16.9 percent. Total Global Services revenue growth was again led
by the growth markets which were up 11.4 percent (13 percent adjusted
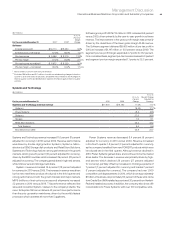
for currency). Within Systems and Technology, Power Systems
delivered revenue growth of 6.3 percent (6 percent adjusted for
currency) while continuing to drive competitive displacements and
extend its share gains in Unix. In the fourth quarter, each of the
company’s 16 brands gained or held share, with the exception of
System z, which had the largest revenue growth in the last decade
in the fourth quarter of 2010. The company estimates that System z
lost share in the fourth quarter, primarily to Power Systems .
The company’s ongoing focus on productivity together with the
relative strength of the Software business drove strong margin
performance in the fourth quarter of 2011. The consolidated gross
profit margin increased 0.9 points versus the fourth quarter of 2010
to 49.9 percent. The operating (non-GAAP) gross margin increased
1.1 points to 50.2 percent. The improvement was driven by margin
expansion in both services segments, and an improved segment
mix due to the Software revenue performance.
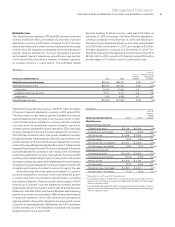
Total expense and other income increased 2.4 percent in the
fourth quarter compared to the prior year. Total operating (non-GAAP)
expense and other income increased 2.1 percent compared to the
fourth quarter of 2010. The year-to-year drivers for both categories
were approximately:
• Acquisitions* 1 point
• Base expense 1 point
* Includes acquisitions completed in prior 12-month period.
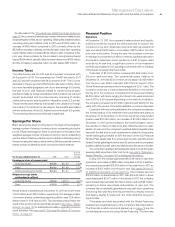
Pre-tax income grew 4.6 percent and the pre-tax margin was
24.7 percent, an increase of 0.7 points versus the fourth quarter of
2010. Net income increased 4.4 percent and the net income margin
of 18.6 percent improved 0.5 points year to year. The effective tax rate
for the fourth quarter was 24.5 percent, compared with 24.4 percent
in the prior year. Operating (non-GAAP) pre-tax income grew
5.6 percent and the operating (non-GAAP) pre-tax margin was
25.1 percent, an increase of 0.9 points versus the prior year. Operating
(non-GAAP) earnings increased 4.5 percent and the operating (non-
GAAP) earnings margin of 19.0 percent increased 0.5 points versus
the prior year. The operating (non-GAAP) effective tax rate was
24.4 percent versus 23.7 percent in the fourth quarter of 2010.
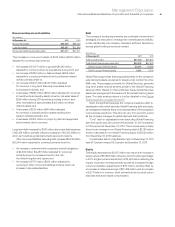
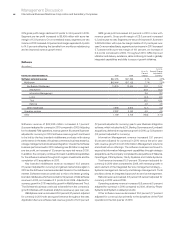
Diluted earnings per share improved 10.5 percent reflecting the
growth in net income and the benefits of the common stock repurchase
program. In the fourth quarter, the company repurchased 19 million
shares of its common stock. Diluted earnings per share of $4.62
increased $0.44 from the prior year. Operating (non-GAAP) diluted
earnings per share of $4.71 increased $0.46 versus the fourth quarter
of 2010 driven by the following factors:
• Revenue increase at actual rates $0.07
• Margin expansion $0.13
• Common stock repurchases $0.26
Gross margin expansion drove $0.19 of operating (non-GAAP)
earnings per share growth, partially offset by a $0.02 per share
impact from expense and a $0.04 per share impact from the higher
tax rate. Overall, margin expansion contributed $0.13 of improvement.