IBM 2011 Annual Report Download - page 22
Download and view the complete annual report
Please find page 22 of the 2011 IBM annual report below. You can navigate through the pages in the report by either clicking on the pages listed below, or by using the keyword search tool below to find specific information within the annual report.-
 1
1 -
2
-
3
-
4
-
5
-
6
-
7
-
8
-
9
-
10
-
11
-
 12
12 -
 13
13 -
 14
14 -
 15
15 -
 16
16 -
 17
17 -
 18
18 -
 19
19 -
 20
20 -
 21
21 -
 22
22 -
 23
23 -
 24
24 -
 25
25 -
 26
26 -
 27
27 -
 28
28 -
 29
29 -
 30
30 -
 31
31 -
 32
32 -
33
-
34
-
35
-
36
-
37
-
38
-
39
-
40
-
41
-
42
-
43
-
44
-
45
-
46
-
47
-
48
-
49
-
50
-
51
-
52
-
53
-
54
-
55
-
56
-
57
-
58
-
59
-
60
-
61
-
62
-
63
-
64
-
65
-
66
-
67
-
68
-
69
-
70
-
71
-
72
-
73
-
74
-
75
-
76
-
77
-
78
-
79
-
80
-
81
-
82
-
83
-
84
-
85
-
86
-
87
-
88
-
89
-
90
-
91
-
92
-
93
-
94
-
95
-
96
-
97
-
98
-
99
-
100
-
101
-
102
-
103
-
104
-
105
-
106
-
107
-
108
-
109
-
110
-
111
-
112
-
113
-
114
-
115
-
116
-
117
-
118
-
119
-
120
-
121
-
122
-
123
-
124
-
125
-
126
-
127
-
128
-
129
-
130
-
131
-
132
-
133
-
134
-
135
-
136
-
137
-
138
-
139
-
140
-
141
-
142
-
143
-
144
-
145
-
146
-
147
-
148
 |
 |

20
Management Discussion
International Business Machines Corporation and Subsidiary Companies
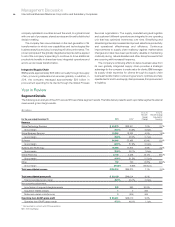
Total expense and other income increased 10.8 percent in 2011
versus the prior year. Total operating (non-GAAP) expense and other
income increased 10.2 percent compared to the prior year. The
year-to-year drivers for both categories were approximately:
• Currency* 4 points
• Acquisitions** 3 points
• Base expense 3 points
* Reflects impacts of translation and hedging programs.
** Includes acquisitions completed in prior 12-month period.
Pre-tax income grew 6.5 percent and the pre-tax margin was
19.6 percent, a decrease of 0.1 points versus 2010. Net income
increased 6.9 percent and the net income margin was 14.8 percent,
flat versus 2010. The effective tax rate for 2011 was 24.5 percent,
compared with 24.8 percent in the prior year. Operating (non-GAAP)
pre-tax income grew 8.7 percent and the operating (non-GAAP)
pre-tax margin was 20.2 percent, an increase of 0.3 points versus
the prior year. Operating (non-GAAP) earnings increased 8.6 percent
and the operating (non-GAAP) earnings margin of 15.3 percent
increased 0.2 points versus the prior year. The operating (non-GAAP)
effective tax rate was 24.5 percent versus 24.4 percent in 2010.
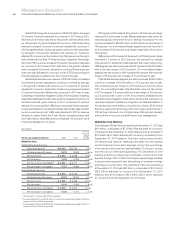
Diluted earnings per share improved 13.4 percent reflecting the
growth in net income and the benefits of the common stock repurchase
program. In 2011, the company repurchased approximately 89 million
shares of its common stock. Diluted earnings per share of $13.06
increased $1.54 from the prior year. Operating (non-GAAP) diluted
earnings per share of $13.44 increased $1.77 versus 2010 driven
by the following factors:
• Revenue increase at actual rates $0.82
• Margin expansion $0.18
• Common stock repurchases $0.77
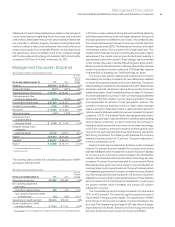
At December 31, 2011, the company’s balance sheet and liquidity
positions remain strong and are well positioned to support the
company’s objectives. Cash and cash equivalents at year end was
$11,922 million. Key drivers in the balance sheet and total cash flows
are highlighted below.
Total assets increased $2,981 million ($4,636 million adjusted for
currency) from December 31, 2010 driven by:
• Increases in total receivables ($1,564 million), cash and cash
equivalents ($1,262 million), goodwill ($1,077 million) and
prepaid expenses and other assets ($1,022 million), partially
offset by
• Decreases in marketable securities ($990 million) and
investments and sundry assets ($883 million).
Total liabilities increased $5,918 million ($6,324 million adjusted for
currency) from December 31, 2010 driven by:
• Increases in total debt ($2,695 million), retirement and
nonpension postretirement benefit obligations ($2,396 million),
accounts payable ($713 million) and deferred income
($798 million), partially offset by
• Decreases in taxes ($903 million).
Total equity of $20,236 million decreased $2,937 million from
December 31, 2010 as a result of:
• Increased treasury stock ($14,803 million) driven by
share repurchases, pension adjustments ($2,448 million)
and currency translation adjustments ($711 million),
partially offset by
• Higher retained earnings ($12,326 million) and common
stock ($2,711 million).
The company generated $19,846 million in cash flow from
operations, an increase of $298 million compared to 2010, primarily
driven by the increase in net income. Net cash used in investing
activities of $4,396 million was $4,111 million lower than 2010, driven
by less cash used for acquisitions ($4,111 million). Net cash used in
financing activities of $13,696 million was $1,267 million higher,
compared to 2010, primarily due to lower cash from common stock
transactions ($991 million) and increased dividend payments ($296
million).
As a result of the strong cash performance, the company continued
to invest in capital and acquisitions and delivered significant returns
to its shareholders with over $18 billion in share repurchase and
dividends in 2011.
The estimated Global Services backlog was $141 billion at
December 31, 2011, down $2 billion (flat adjusted for currency) versus
the prior year-end balance, and up $4 billion ($5 billion adjusted for
currency), from September 30, 2011.
In January 2012, the company disclosed that it is expecting GAAP
earnings of at least $14.16 and operating (non-GAAP) earnings of at
least $14.85 per diluted share for the full year 2012.
For additional information and details, see the “Year in Review”
section on pages 26 through 43.
Description of Business
Please refer to IBM’s Annual Report on Form 10-K filed with
the SEC on February 28, 2012 for a more detailed version of this
Des cription of Business, especially Item 1A. entitled “Risk Factors.”
The company creates business value for clients and solves
business problems through integrated solutions that leverage
information technology and deep knowledge of business processes.
IBM solutions typically create value by reducing a client’s operational
costs or by enabling new capabilities that generate revenue. These
solutions draw from an industry-leading portfolio of consulting,
delivery and implementation services, enterprise software, systems
and financing.