IBM 2011 Annual Report Download - page 13
Download and view the complete annual report
Please find page 13 of the 2011 IBM annual report below. You can navigate through the pages in the report by either clicking on the pages listed below, or by using the keyword search tool below to find specific information within the annual report.-
 1
1 -
2
-
 3
3 -
 4
4 -
 5
5 -
 6
6 -
 7
7 -
 8
8 -
 9
9 -
 10
10 -
 11
11 -
 12
12 -
 13
13 -
 14
14 -
 15
15 -
 16
16 -
 17
17 -
 18
18 -
 19
19 -
 20
20 -
 21
21 -
 22
22 -
 23
23 -
24
-
25
-
26
-
27
-
28
-
29
-
30
-
31
-
32
-
33
-
34
-
35
-
36
-
37
-
38
-
39
-
40
-
41
-
42
-
43
-
44
-
45
-
46
-
47
-
48
-
49
-
50
-
51
-
52
-
53
-
54
-
55
-
56
-
57
-
58
-
59
-
60
-
61
-
62
-
63
-
64
-
65
-
66
-
67
-
68
-
69
-
70
-
71
-
72
-
73
-
74
-
75
-
76
-
77
-
78
-
79
-
80
-
81
-
82
-
83
-
84
-
85
-
86
-
87
-
88
-
89
-
90
-
91
-
92
-
93
-
94
-
95
-
96
-
97
-
98
-
99
-
100
-
101
-
102
-
103
-
104
-
105
-
106
-
107
-
108
-
109
-
110
-
111
-
112
-
113
-
114
-
115
-
116
-
117
-
118
-
119
-
120
-
121
-
122
-
123
-
124
-
125
-
126
-
127
-
128
-
129
-
130
-
131
-
132
-
133
-
134
-
135
-
136
-
137
-
138
-
139
-
140
-
141
-
142
-
143
-
144
-
145
-
146
-
147
-
148
 |
 |
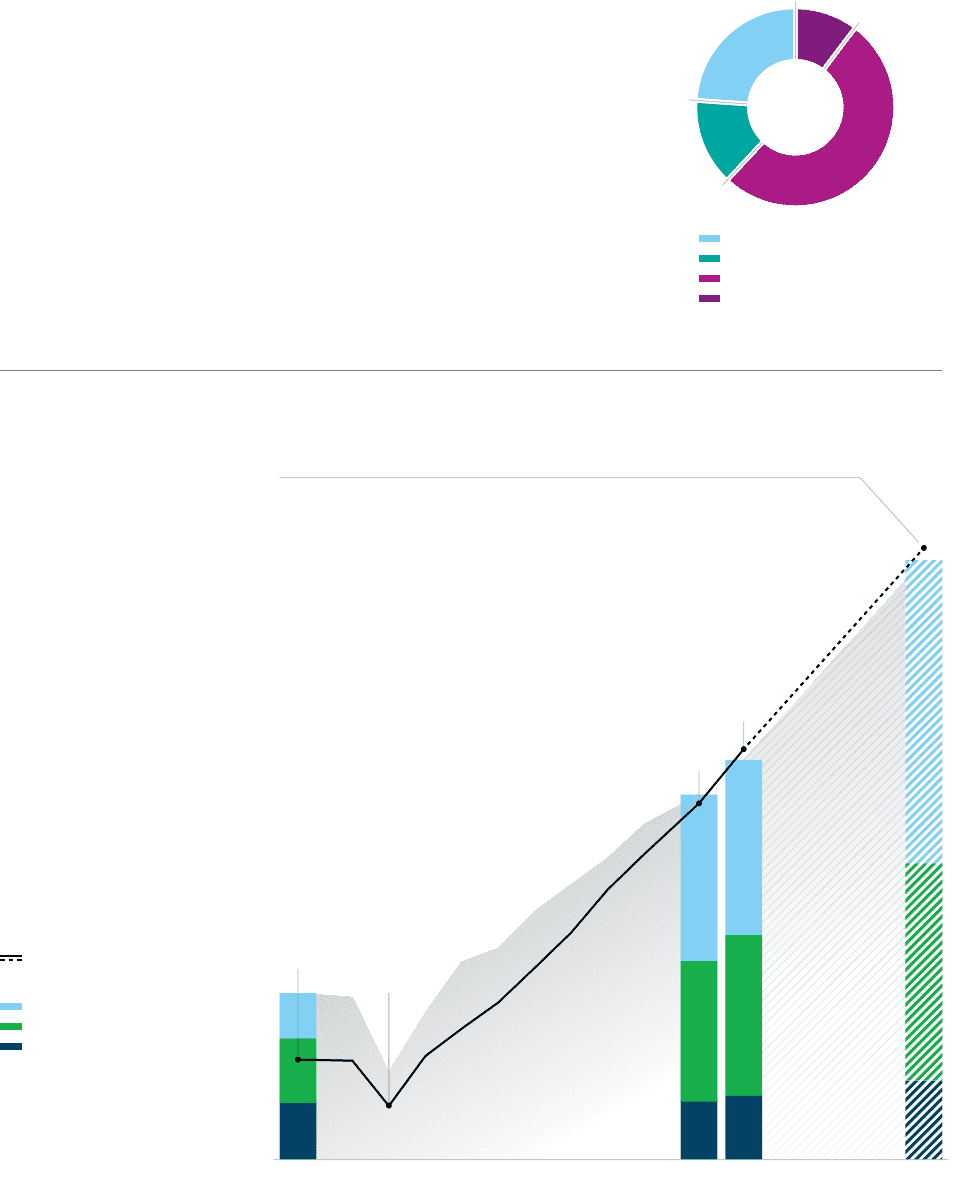
201120102000 2002
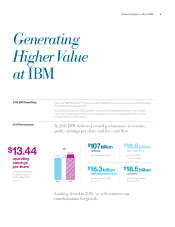
$13.44
$11.67
$3.32
$1.81
2015
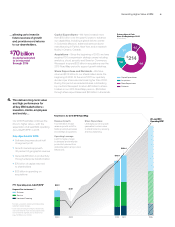
This delivers long-term value
and high performance for
all key IBM stakeholders—
investors, clients, employees
and society …
Our 2015 Road Map continues the
drive to higher value—with the
expectation of at least $20 operating
(non-GAAP) EPS* in 2015.
Key objectives for 2015:
+ Software becomes about half
of segment profit
+ Growth markets approach
30 percent of geographic revenue
+ Generate $8 billion in productivity
through enterprise transformation
+ $70 billion of capital returned
to shareholders
+ $20 billion in spending on
acquisitions
Capital Expenditures—We have invested more
than $50 billion over the past 12 years to advance
our capabilities, including a global delivery center
in Columbia, Missouri, advanced semiconductor
manufacturing in Fishkill, New York, and a research
facility in Ontario, Canada.
Acquisitions—Since the beginning of 2000, we have
acquired 130 companies in strategic areas including
analytics, cloud, security and Smarter Commerce.
We expect to spend $20 billion in acquisitions over the
2015 Road Map period to support growth initiatives.
Share Repurchase and Dividends—We have
returned $133 billion to our shareholders since the
beginning of 2000. At the end of 2011 our quarterly
dividend per share was six times higher than 2000.
During this period we reduced shares outstanding
by one third. We expect to return $70 billion to share-
holders in our 2015 Road Map period—$50 billion
through share repurchases and $20 billion in dividends.
Key Drivers for 2015 EPS Road Map
4.
… allowing us to invest in
future sources of growth
and provide record returns
to our shareholders.
$70 billion
in capital expected
to be returned
through 2015
* Excludes acquisition-related and nonoperating
retirement-related charges.
** 2000 and 2001 exclude Enterprise Investments
and not restated for stock-based compensation.
Sum of external segment pre-tax income not
equal to IBM pre-tax income.
At Least $20
Operating EPS*
Revenue Growth
A combination of base
revenue growth, a shift to
faster growing businesses
and strategic acquisitions.
Operating Leverage
A shift to higher-margin
businesses and enterprise
productivity derived from
global integration and process
efficiencies.
Share Repurchase
Leveraging our strong cash
generation to return value
to shareholders by reducing
shares outstanding.
Operating (non-GAAP) EPS*
Segment Pre-tax Income*, **
Software
Services
Hardware/Financing
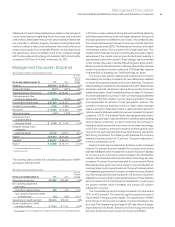
Primary Uses of Cash
Since the Beginning of 2000
($ in billions)
$214
$111
$22
$30
$51
Capital Expenditures
Acquisitions
Share Repurchases
Dividends
Generating Higher Value at IBM 11