IBM 2011 Annual Report Download - page 72
Download and view the complete annual report
Please find page 72 of the 2011 IBM annual report below. You can navigate through the pages in the report by either clicking on the pages listed below, or by using the keyword search tool below to find specific information within the annual report.-
 1
1 -
2
-
3
-
4
-
5
-
6
-
7
-
8
-
9
-
10
-
11
-
12
-
13
-
14
-
15
-
16
-
17
-
18
-
19
-
20
-
21
-
22
-
23
-
24
-
25
-
26
-
27
-
28
-
29
-
30
-
31
-
32
-
33
-
34
-
35
-
36
-
37
-
38
-
39
-
40
-
41
-
42
-
43
-
44
-
45
-
46
-
47
-
48
-
49
-
50
-
51
-
52
-
53
-
54
-
55
-
56
-
57
-
58
-
59
-
60
-
61
-
 62
62 -
 63
63 -
 64
64 -
 65
65 -
 66
66 -
 67
67 -
 68
68 -
 69
69 -
 70
70 -
 71
71 -
 72
72 -
 73
73 -
 74
74 -
 75
75 -
 76
76 -
 77
77 -
 78
78 -
 79
79 -
 80
80 -
 81
81 -
 82
82 -
83
-
84
-
85
-
86
-
87
-
88
-
89
-
90
-
91
-
92
-
93
-
94
-
95
-
96
-
97
-
98
-
99
-
100
-
101
-
102
-
103
-
104
-
105
-
106
-
107
-
108
-
109
-
110
-
111
-
112
-
113
-
114
-
115
-
116
-
117
-
118
-
119
-
120
-
121
-
122
-
123
-
124
-
125
-
126
-
127
-
128
-
129
-
130
-
131
-
132
-
133
-
134
-
135
-
136
-
137
-
138
-
139
-
140
-
141
-
142
-
143
-
144
-
145
-
146
-
147
-
148
 |
 |

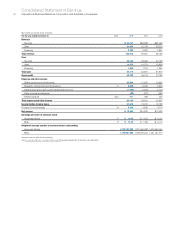
70
Consolidated Statement of Earnings
International Business Machines Corporation and Subsidiary Companies
($ in millions except per share amounts)
For the year ended December 31: Notes 2011 2010 2009
Revenue
Services $ 60,721 $56,868 $55,128
Sales 44,063 40,736 38,300
Financing 2,132 2,267 2,331
Total revenue 106,916 99,870 95,758
Cost
Services 40,740 38,383 37,146
Sales 14,973 14,374 13,606
Financing 1,065 1,100 1,220
Total cost 56,778 53,857 51,973
Gross profit 50,138 46,014 43,785
Expense and other income
Selling, general and administrative 23,594 21,837 20,952
Research, development and engineering O6,258 6,026 5,820
Intellectual property and custom development income (1,108) (1,154)(1,177)
Other (income) and expense (20) (787)(351)
Interest expense D&J 411 368 402
Total expense and other income 29,135 26,291 25,647
Income before income taxes 21,003 19,723 18,138
Provision for income taxes N5,148 4,890 4,713
Net income $ 15,855 $14,833 $13,425
Earnings per share of common stock
Assuming dilution P$ 13.06 $ 11.52 $ 10.01
Basic P$ 13.25 $ 11.69 $ 10.12
Weighted-average number of common shares outstanding
Assuming dilution 1,213,767,985 1,287,355,388 1,341,352,754
Basic 1,196,951,006 1,268,789,202 1,327,157,410
Amounts may not add due to rounding.
The accompanying notes on pages 76 through 139 are an integral part of the financial statements.