IBM 2011 Annual Report Download - page 32
Download and view the complete annual report
Please find page 32 of the 2011 IBM annual report below. You can navigate through the pages in the report by either clicking on the pages listed below, or by using the keyword search tool below to find specific information within the annual report.-
 1
1 -
2
-
3
-
4
-
5
-
6
-
7
-
8
-
9
-
10
-
11
-
12
-
13
-
14
-
15
-
16
-
17
-
18
-
19
-
20
-
21
-
 22
22 -
 23
23 -
 24
24 -
 25
25 -
 26
26 -
 27
27 -
 28
28 -
 29
29 -
 30
30 -
 31
31 -
 32
32 -
 33
33 -
 34
34 -
 35
35 -
 36
36 -
 37
37 -
 38
38 -
 39
39 -
 40
40 -
 41
41 -
 42
42 -
43
-
44
-
45
-
46
-
47
-
48
-
49
-
50
-
51
-
52
-
53
-
54
-
55
-
56
-
57
-
58
-
59
-
60
-
61
-
62
-
63
-
64
-
65
-
66
-
67
-
68
-
69
-
70
-
71
-
72
-
73
-
74
-
75
-
76
-
77
-
78
-
79
-
80
-
81
-
82
-
83
-
84
-
85
-
86
-
87
-
88
-
89
-
90
-
91
-
92
-
93
-
94
-
95
-
96
-
97
-
98
-
99
-
100
-
101
-
102
-
103
-
104
-
105
-
106
-
107
-
108
-
109
-
110
-
111
-
112
-
113
-
114
-
115
-
116
-
117
-
118
-
119
-
120
-
121
-
122
-
123
-
124
-
125
-
126
-
127
-
128
-
129
-
130
-
131
-
132
-
133
-
134
-
135
-
136
-
137
-
138
-
139
-
140
-
141
-
142
-
143
-
144
-
145
-
146
-
147
-
148
 |
 |

30
Management Discussion
International Business Machines Corporation and Subsidiary Companies
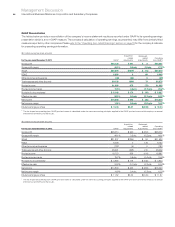
Software revenue of $24,944 million increased 10.9 percent (8 percent
adjusted for currency) in 2011 compared to 2010. Adjusting for the
divested PLM operations, revenue grew at 11.8 percent (9 percent
adjusted for currency) in 2011. Revenue growth was driven by key
branded middleware, reflecting continued strong demand for the
company’s offerings and solid growth in key focus areas such as
Smarter Commerce and business analytics. Overall, the Software
business had another very good year in 2011, delivering nearly
$10 billion in segment pre-tax income, an increase of $500 million
from 2010. The company continues to invest in additional capabilities
for the Software business through both organic investments and
strategic acquisitions, including the completion of five acquisitions in
2011, plus acquisitions announced in the fourth quarter of 2011 that
closed in the first quarter of 2012.
Key branded middleware revenue increased 15.6 percent
(13 percent adjusted for currency) and again gained market share
in 2011, as the Software business extended its lead in the middleware
market. Software revenue continued to mix to the faster growing
branded middleware which accounted for 64 percent of total software
revenue in 2011, an increase of 3 points from 2010. Performance in
2011 was led by strong double-digit growth in WebSphere. The Software
business continued to have solid performance in its growth initiatives,
with business analytics revenue up double digits in 2011 year to year.
WebSphere revenue increased 40.5 percent (37 percent adjusted
for currency) in 2011 with strong performance throughout the year
and gained share. WebSphere’s five product areas all had revenue
growth of 18 percent or higher in 2011, led by the Smarter Commerce
offerings, which more than tripled year to year. This performance
contributed to the company’s overall growth in the retail industry in
each of the last two years. The 2010 acquisitions of Sterling
Commerce, Coremetrics and Unica Corporation all contributed to
the WebSphere year-to-year performance.
Information Management revenue increased 12.5 percent
(10 percent adjusted for currency) and gained share in 2011 compared
to 2010. Distributed Database revenue increased 33 percent in 2011,
led by strong performance from the Netezza offerings. Since
acquiring Netezza in November 2010, the Software business has
expanded its customer base by over 40 percent. The company’s
business analytics software offerings, most of which are part of
Information Management, continue to outpace the market with
double-digit revenue growth, year to year in 2011.
Lotus revenue increased 3.8 percent (flat adjusted for currency)
in 2011 compared to 2010, with growth driven by the Social Business
offerings.
Tivoli revenue increased 10.2 percent (7 percent adjusted for
currency) in 2011 when compared to 2010 and gained share. Revenue
growth was led by Storage software with growth of 25 percent
(22 percent adjusted for currency). Security solutions software also
delivered growth in 2011, with revenue up 9 percent (6 percent
adjusted for currency).
Rational revenue increased 4.9 percent (2 percent adjusted for
currency) in 2011 versus 2010 and gained share. Revenue growth
was driven by Telelogic, which increased 11 percent (7 percent
adjusted for currency) year to year.
Operating systems revenue increased 8.6 percent (6 percent
adjusted for currency) in 2011 compared to 2010, driven primarily by
growth in Power Systems.
Other software revenue increased 3.2 percent (flat adjusted for
currency) with growth in software-related services partially offset
by the divestiture of the PLM operations in the first quarter of 2010.
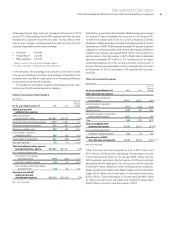
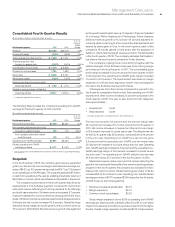
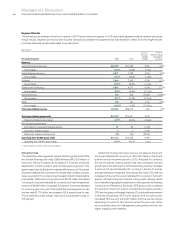
($ in millions)
For the year ended December 31: 2011 2010*
Yr.-to-Yr.
Percent/
Margin
Change
Software
External gross profit $22,065 $19,774 11.6%
External gross profit margin 88.5% 87.9% 0.5 pts.
Pre-tax income $ 9,970 $ 9,466 5.3%
Pre-tax margin 35.3% 37.2% (1.9) pts.
Pre-tax income—normalized** $10,009 $ 8,972 11.6%
Pre-tax margin—normalized 35.5% 35.3% 0.2 pts.
* Reclassified to conform with 2011 presentation.
**
Excludes $39 million and $98 million of workforce rebalancing charges in the first
quarter of 2011 and 2010, respectively, and $(591) million related to the PLM gain in
the first quarter of 2010.
Software gross profit increased 11.6 percent to $22,065 million in
2011 driven primarily by the growth in revenue. Gross profit margin
improved 0.5 points versus 2010. Software delivered segment
pre-tax income of $9,970 million in 2011, an increase of 5.3 percent
versus 2010. On a normalized basis, segment pre-tax income
increased 11.6 percent and segment pre-tax margin improved
0.2 points to 35.5 percent in 2011. The Software segment delivered
strong margin and profit growth in 2011 and contributed to the
company’s continued margin expansion and profit performance.