IBM 2011 Annual Report Download - page 52
Download and view the complete annual report
Please find page 52 of the 2011 IBM annual report below. You can navigate through the pages in the report by either clicking on the pages listed below, or by using the keyword search tool below to find specific information within the annual report.-
 1
1 -
2
-
3
-
4
-
5
-
6
-
7
-
8
-
9
-
10
-
11
-
12
-
13
-
14
-
15
-
16
-
17
-
18
-
19
-
20
-
21
-
22
-
23
-
24
-
25
-
26
-
27
-
28
-
29
-
30
-
31
-
32
-
33
-
34
-
35
-
36
-
37
-
38
-
39
-
40
-
41
-
 42
42 -
 43
43 -
 44
44 -
 45
45 -
 46
46 -
 47
47 -
 48
48 -
 49
49 -
 50
50 -
 51
51 -
 52
52 -
 53
53 -
 54
54 -
 55
55 -
 56
56 -
 57
57 -
 58
58 -
 59
59 -
 60
60 -
 61
61 -
 62
62 -
63
-
64
-
65
-
66
-
67
-
68
-
69
-
70
-
71
-
72
-
73
-
74
-
75
-
76
-
77
-
78
-
79
-
80
-
81
-
82
-
83
-
84
-
85
-
86
-
87
-
88
-
89
-
90
-
91
-
92
-
93
-
94
-
95
-
96
-
97
-
98
-
99
-
100
-
101
-
102
-
103
-
104
-
105
-
106
-
107
-
108
-
109
-
110
-
111
-
112
-
113
-
114
-
115
-
116
-
117
-
118
-
119
-
120
-
121
-
122
-
123
-
124
-
125
-
126
-
127
-
128
-
129
-
130
-
131
-
132
-
133
-
134
-
135
-
136
-
137
-
138
-
139
-
140
-
141
-
142
-
143
-
144
-
145
-
146
-
147
-
148
 |
 |

50
Management Discussion
International Business Machines Corporation and Subsidiary Companies
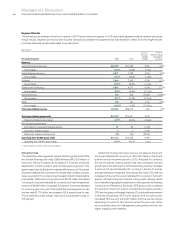
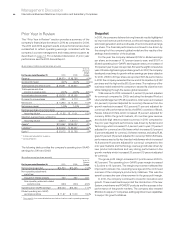
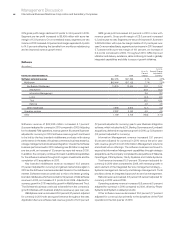
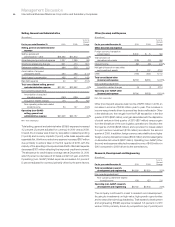
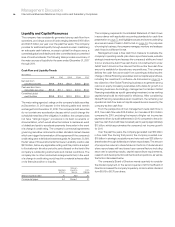
Geographic Revenue
In addition to the revenue presentation by reportable segment, the company also measures revenue performance on a geographic basis.
The following geographic, regional and country-specific revenue performance excludes OEM revenue, which is discussed separately below.
($ in millions)
For the year ended December 31: 2010 2009
Yr.-to-Yr.
Percent
Change
Yr.-to-Yr.
Percent Change
Adjusted for
Currency
Total revenue $99,870 $95,758 4.3% 3.3%
Geographies $97,060 $93,477 3.8% 2.8%
Americas 42,044 40,184 4.6 3.5
Europe/Middle East/Africa 31,866 32,583 (2.2) 0.8
Asia Pacific 23,150 20,710 11.8 4.7
Major markets 1.1% 1.0%
Growth markets 16.0% 10.9%
BRIC countries 22.8% 18.4%
Total geographic revenue increased 3.8 percent (3 percent adjusted for currency) to $97,060 million in 2010 when compared to 2009, with
constant currency growth in each of the geographic areas and markets. Overall performance was driven by the growth markets.
System x revenue increased 27.5 percent (27 percent adjusted
for currency) in 2010 versus 2009. In the growth markets, revenue
increased 30 percent versus the prior year. High-end System x revenue
increased 22 percent (21 percent adjusted for currency) in 2010
versus 2009, while total server revenue increased 27 percent
(27 percent adjusted for currency) in 2010 versus 2009. System x
blades revenue increased 20 percent (20 percent adjusted for
currency) versus the prior year.
Storage revenue increased 7.6 percent (8 percent adjusted for
currency) in 2010 versus the prior year. In the growth markets, storage
revenue grew 21 percent year over year (21 percent adjusted for
currency). Total disk revenue increased 13 percent (14 percent
adjusted for currency) in 2010 versus 2009. The increase was driven
by strength in enterprise disk products which increased 16.4 percent
(17 percent adjusted for currency) led by XIV and DS8000. Through
December 2010, XIV added over 975 new customers since the
acquisition in the fourth quarter of 2007. Tape revenue declined
6 percent in 2010 versus 2009.
Microelectronics OEM revenue increased 24.8 percent (25 percent
adjusted for currency) in 2010 versus 2009. The company had strong
revenue growth from its OEM customers in networking, game
consoles and wireless communications.
Retail Stores Solutions revenue increased 22.4 percent (23 percent
adjusted for currency) in 2010 versus 2009 as the company extended
its leadership position as a point of sale provider.
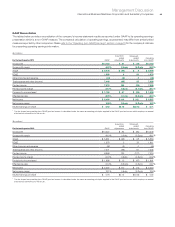
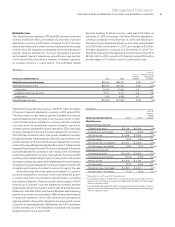
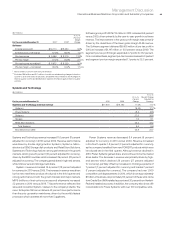
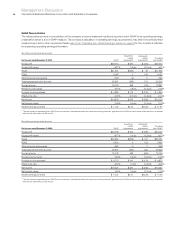
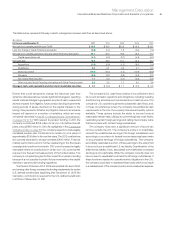
($ in millions)
For the year ended December 31: 2010*2009*
Yr.-to-Yr.
Percent/
Margin
Change
Systems and Technology
External gross profit $6,856 $6,069 13.0%
External gross profit margin 38.1% 37.5% 0.7 pts.
Pre-tax income $1,456 $1,298 12.1%
Pre-tax margin 7.8% 7.6%0.2 pts.
Pre-tax income—normalized** $1,513 $1,238 22.2%
Pre-tax margin—normalized 8.1%7.2%0.8 pts.
* Reclassified to conform with 2011 presentation.
** Excludes $57 million and $4 million of workforce rebalancing charges in the first
quarter of 2010 and 2009, respectively, and $(64) million related to the Geodis gain
in the first quarter of 2009.
The increase in external gross profit for 2010 versus 2009 was due
to improved operating leverage driven by higher revenue.
Overall gross margin increased 0.7 points in 2010 versus the prior
year. The increase was primarily driven by improved margins in Micro-
electronics (1.6 points), System x (0.8 points) and Storage (0.3 points),
partially offset by a decline due to revenue mix (0.9 points) and lower
margins in Power Systems (0.6 points) and System z (0.5 points).
Systems and Technology’s pre-tax income increased 22.2 percent
in 2010 on a normalized basis when compared to the prior year.
Pre-tax margin increased 0.8 points in 2010 on a normalized basis
versus 2009.
Global Financing
See pages 63 through 67 for an analysis of Global Financing’s
segment results.