IBM 2011 Annual Report Download - page 53
Download and view the complete annual report
Please find page 53 of the 2011 IBM annual report below. You can navigate through the pages in the report by either clicking on the pages listed below, or by using the keyword search tool below to find specific information within the annual report.-
 1
1 -
2
-
3
-
4
-
5
-
6
-
7
-
8
-
9
-
10
-
11
-
12
-
13
-
14
-
15
-
16
-
17
-
18
-
19
-
20
-
21
-
22
-
23
-
24
-
25
-
26
-
27
-
28
-
29
-
30
-
31
-
32
-
33
-
34
-
35
-
36
-
37
-
38
-
39
-
40
-
41
-
42
-
 43
43 -
 44
44 -
 45
45 -
 46
46 -
 47
47 -
 48
48 -
 49
49 -
 50
50 -
 51
51 -
 52
52 -
 53
53 -
 54
54 -
 55
55 -
 56
56 -
 57
57 -
 58
58 -
 59
59 -
 60
60 -
 61
61 -
 62
62 -
 63
63 -
64
-
65
-
66
-
67
-
68
-
69
-
70
-
71
-
72
-
73
-
74
-
75
-
76
-
77
-
78
-
79
-
80
-
81
-
82
-
83
-
84
-
85
-
86
-
87
-
88
-
89
-
90
-
91
-
92
-
93
-
94
-
95
-
96
-
97
-
98
-
99
-
100
-
101
-
102
-
103
-
104
-
105
-
106
-
107
-
108
-
109
-
110
-
111
-
112
-
113
-
114
-
115
-
116
-
117
-
118
-
119
-
120
-
121
-
122
-
123
-
124
-
125
-
126
-
127
-
128
-
129
-
130
-
131
-
132
-
133
-
134
-
135
-
136
-
137
-
138
-
139
-
140
-
141
-
142
-
143
-
144
-
145
-
146
-
147
-
148
 |
 |

51
Management Discussion
International Business Machines Corporation and Subsidiary Companies
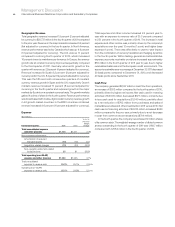
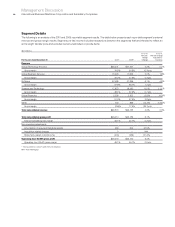
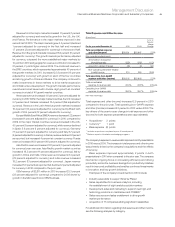
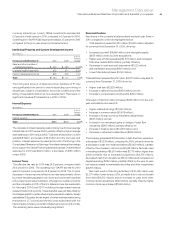
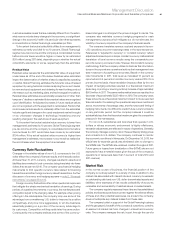
Total Expense and Other Income
($ in millions)
For the year ended December 31: 2010 2009
Yr.-to-Yr.
Percent/
Margin
Change
Total consolidated expense
and other (income) $26,291 $25,647 2.5%
Non-operating adjustments
Amortization of acquired
intangible assets (253) (285) (11.3)
Acquisition-related charges (46) (9) NM
Non-operating retirement-related
(costs)/income 210 250 (15.9)
Total operating (non-GAAP)
expense and other (income) $26,202 $25,603 2.3%
Total consolidated
expense-to-revenue ratio 26.3% 26.8%(0.5) pts.
Operating (non-GAAP)
expense-to-revenue ratio 26.2%26.7%(0.5) pts.
NM—Not meaningful
Total expense and other (income) increased 2.5 percent in 2010
compared to the prior year. Total operating (non-GAAP) expense
and other (income) increased 2.3 percent in 2010 versus 2009. The
key drivers of the year-to-year change in total expense and other
(income) for both expense presentations were approximately:
• Acquisitions* 3 points
• Currency** 1 point
• Base expense (2) points
* Includes acquisitions completed in prior 12-month period.
** Reflects impacts of tranlation and hedging programs.
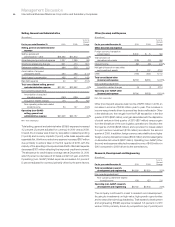
The company’s expense-to-revenue ratio improved in both presentations
in 2010 versus 2009. The increase in total expense and other income
was primarily driven by the company’s acquisitions and the effects
of currency.
Base expense improved approximately 2 points in both
presentations in 2010 when compared to the prior year. The company
has had an ongoing focus on increasing efficiency and driving
productivity across the business. Savings from productivity initiatives
result in improved profitability and enables continued investments
in innovation and key growth initiatives.
Examples of the company’s investments in 2010 include:
• Industry sales skills to support Smarter Planet
• Sales capabilities for business analytics, including
the establishment of eight analytics solution centers
• Development, sales and marketing to support new high-end
technology solutions in mainframes and POWER7
• Sales resources and sales enablement to drive growth
market performance
• Acquisition of 17 companies adding significant capabilities
For additional information regarding total expense and other income,
see the following analyses by category.
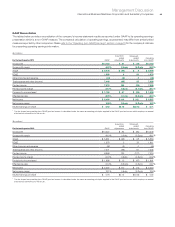
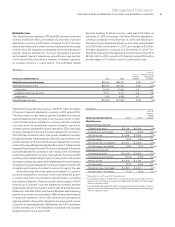
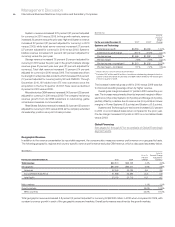
Revenue from the major markets increased 1.1 percent (1 percent
adjusted for currency) and was led by growth in the U.S., the U.K.
and France. Performance in the major markets improved in the
second half of 2010. The major markets grew 0.3 percent (declined
1 percent adjusted for currency) in the first half and increased
1.7 percent (3 percent adjusted for currency) in the second half.
Revenue from the growth markets increased 16.0 percent (11 percent
adjusted for currency). The growth markets performance, adjusted
for currency, outpaced the more established major markets by
10 points in 2010 and geographic revenue contribution increased to
21 percent, 2 points higher versus 2009. The combined revenue in
the BRIC countries, which represented approximately 40 percent of
the growth markets in 2010, increased 22.8 percent (18 percent
adjusted for currency) with growth in each of the four countries
and strong growth in China and Russia. The company continued to
make investments in these markets to drive market expansion
and infrastructure development. The growth markets performance
overall was broad based with double-digit growth at constant
currency in a total of 40 growth market countries.
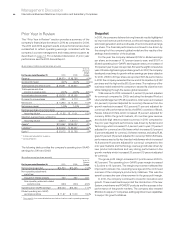
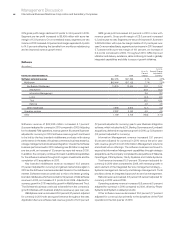
Americas revenue increased 4.6 percent (3 percent adjusted for
currency) in 2010. Within the major market countries, the U.S. increased
2.7 percent and Canada increased 10.4 percent (flat adjusted for
currency). Revenue in the Latin America growth markets increased
15.4 percent (14 percent adjusted for currency) led by Brazil with
growth of 20.4 percent (12 percent adjusted for currency).
Europe/Middle East/Africa (EMEA) revenue decreased 2.2 percent
(increased 1 percent adjusted for currency) in 2010 compared to
2009. In the major market countries, revenue increased in the U.K.
4.5 percent (6 percent adjusted for currency), while revenue declined
in Spain 5.6 percent (1 percent adjusted for currency), Germany
7.7 percent (3 percent adjusted for currency) and Italy 8.7 percent
(4 percent adjusted for currency). In France, revenue declined 1.8 percent
as reported, but increased 4 percent at constant currency. Russia
revenue increased 49.0 percent (48 percent adjusted for currency).
Asia Pacific revenue increased 11.8 percent (5 percent adjusted
for currency) year over year. Asia Pacific growth market countries
increased 18.3 percent (11 percent adjusted for currency), led by
growth in China and India. China revenue increased 23.4 percent
(23 percent adjusted for currency) and India revenue increased
19.2 percent (13 percent adjusted for currency). Japan revenue
increased 5.0 percent as reported but declined 2 percent adjusted
for currency in 2010 compared to the prior year.
OEM revenue of $2,811 million in 2010 increased 23.3 percent
(23 percent adjusted for currency) compared to 2009 driven by
growth in the Microelectronics OEM business.